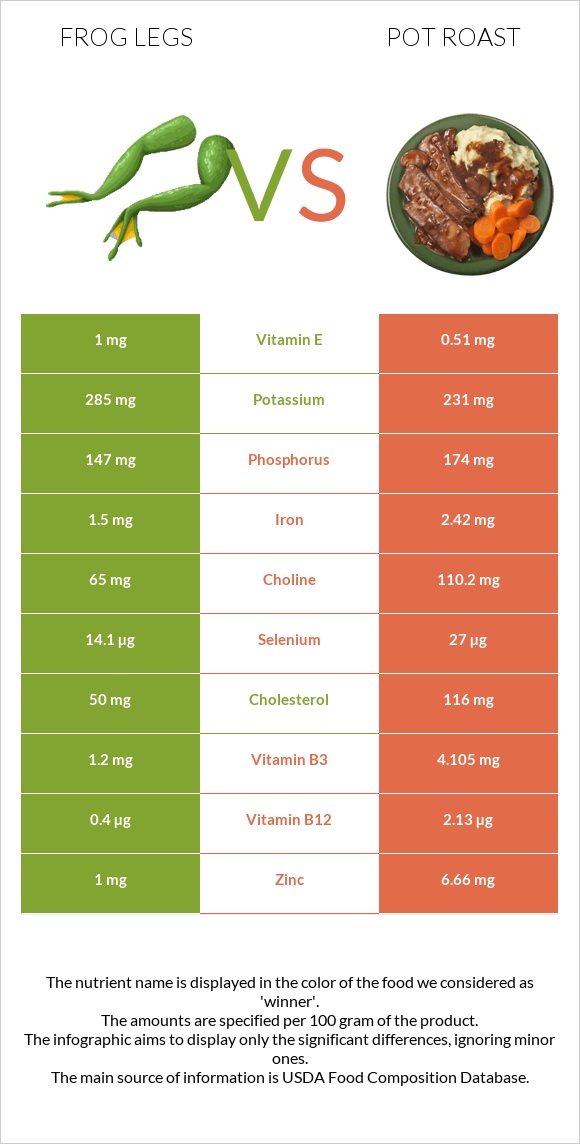
Summary of differences between frog legs and pot roast Frog legs have more copper, while pot roast has more vitamin B12, zinc, selenium, vitamin B3, vitamin B6, iron, and choline. Pot roast covers your daily need for vitamin B12, 72% more than frog legs. Frog legs contain 3 times more copper than pot roast. While frog legs contain 0.25mg of copper, pot roast contains only 0.099mg. The amount of cholesterol in frog legs is lower. These are the specific foods used in this comparison Frog legs, raw and Beef, chuck, arm pot roast, separable lean, and fat, trimmed to 0" fat, all grades, cooked, braised .
Infographic
Mineral Comparison
Mineral comparison score is based on the number of minerals by which one or the other food is richer. The "coverage" charts below show how much of the daily needs can be covered by 300 grams of the food.
3
100 g
300 g
1 leg - 45g
Magnesium
Magnesium
Calcium
Calcium
Potassium
Potassium
Iron
Iron
Copper
Copper
Zinc
Zinc
Phosphorus
Phosphorus
Sodium
Sodium
Manganese
Manganese
Selenium
Selenium
14%
5.4%
25%
56%
83%
27%
63%
7.6%
0%
77%
6
100 g
300 g
3 oz - 85g 1 roast (yield from 1601 g raw meat) - 1166g
Magnesium
Magnesium
Calcium
Calcium
Potassium
Potassium
Iron
Iron
Copper
Copper
Zinc
Zinc
Phosphorus
Phosphorus
Sodium
Sodium
Manganese
Manganese
Selenium
Selenium
14%
4.8%
20%
91%
33%
182%
75%
6.1%
1.3%
147%
Vitamin Comparison
Vitamin comparison score is based on the number of vitamins by which one or the other food is richer. The "coverage" charts below show how much of the daily needs can be covered by 300 grams of the food.
5
100 g
300 g
1 leg - 45g
Vitamin C
Vit. C
Vitamin D
Vit. D
Vitamin A
Vit. A
Vitamin E
Vit. E
Vitamin B1
Vit. B1
Vitamin B2
Vit. B2
Vitamin B3
Vit. B3
Vitamin B5
Vit. B5
Vitamin B6
Vit. B6
Vitamin B12
Vit. B12
Vitamin K
Vit. K
Folate
Folate
0%
3%
5%
20%
35%
58%
23%
0%
28%
50%
0.25%
11%
5
100 g
300 g
3 oz - 85g 1 roast (yield from 1601 g raw meat) - 1166g
Vitamin C
Vit. C
Vitamin D
Vit. D
Vitamin A
Vit. A
Vitamin E
Vit. E
Vitamin B1
Vit. B1
Vitamin B2
Vit. B2
Vitamin B3
Vit. B3
Vitamin B5
Vit. B5
Vitamin B6
Vit. B6
Vitamin B12
Vit. B12
Vitamin K
Vit. K
Folate
Folate
0%
3%
0%
10%
15%
39%
77%
34%
65%
266%
4.5%
6.8%
All nutrients comparison - raw data values
Nutrient
DV% diff.
Vitamin B12
0.4µg
2.13µg
72%
Zinc
1mg
6.66mg
51%
Saturated fat
0.076g
7.548g
34%
Fats
0.3g
19.17g
29%
Protein
16.4g
28.94g
25%
Selenium
14.1µg
27µg
23%
Cholesterol
50mg
116mg
22%
Monounsaturated fat
0.053g
8.175g
20%
Vitamin B3
1.2mg
4.105mg
18%
Copper
0.25mg
0.099mg
17%
Vitamin B6
0.12mg
0.283mg
13%
Iron
1.5mg
2.42mg
12%
Calories
73kcal
297kcal
11%
Vitamin B5
0.571mg
11%
Choline
65mg
110.2mg
8%
Vitamin B1
0.14mg
0.059mg
7%
Vitamin B2
0.25mg
0.171mg
6%
Phosphorus
147mg
174mg
4%
Polyunsaturated fat
0.102g
0.708g
4%
Vitamin E
1mg
0.51mg
3%
Potassium
285mg
231mg
2%
Vitamin A
15µg
0µg
2%
Folate
15µg
9µg
2%
Vitamin K
0.1µg
1.8µg
1%
Protein per 100 calories
22g
9.7g
N/A
Calories per 10 g protein
45kcal
103kcal
N/A
Weight per 100 calories
137g
34g
N/A
Unsaturated / Saturated Fat ratio
2
1.2
N/A
Vitamin D*
8 IU
8 IU
0%
Vitamin D
0.2µg
0.2µg
0%
Magnesium
20mg
19mg
0%
Calcium
18mg
16mg
0%
Sodium
58mg
47mg
0%
Manganese
0.01mg
0%
Tryptophan
0.19mg
0%
Threonine
1.156mg
0%
Isoleucine
1.317mg
0%
Leucine
2.302mg
0%
Lysine
2.446mg
0%
Methionine
0.754mg
0%
Phenylalanine
1.143mg
0%
Valine
1.436mg
0%
Histidine
0.924mg
0%
Omega-3 - EPA
0.014g
0g
N/A
Omega-3 - DHA
0.02g
0g
N/A
Omega-3 - DPA
0.007g
0g
N/A
Macronutrient Comparison
Macronutrient breakdown side-by-side comparison
2
16%
82%
Protein:
16.4 g
Fats:
0.3 g
Carbs:
0 g
Water:
81.9 g
Other:
1.4 g
2
29%
19%
52%
Protein:
28.94 g
Fats:
19.17 g
Carbs:
0 g
Water:
51.9 g
Other:
0 g
Contains
more
Water Water
+57.8%
Contains
more
Other Other
+∞%
Contains
more
Protein Protein
+76.5%
Contains
more
Fats Fats
+6290%
Fat Type Comparison
Fat type breakdown side-by-side comparison
1
33%
23%
44%
Saturated fat:
Sat. Fat
0.076 g
Monounsaturated fat:
Mono. Fat
0.053 g
Polyunsaturated fat:
Poly. Fat
0.102 g
2
46%
50%
4%
Saturated fat:
Sat. Fat
7.548 g
Monounsaturated fat:
Mono. Fat
8.175 g
Polyunsaturated fat:
Poly. Fat
0.708 g
Contains
less
Sat. Fat Saturated fat
-99%
Contains
more
Mono. Fat Monounsaturated fat
+15324.5%
Contains
more
Poly. Fat Polyunsaturated fat
+594.1%