Fruit roll ups vs. Pilaf — In-Depth Nutrition Comparison
Compare
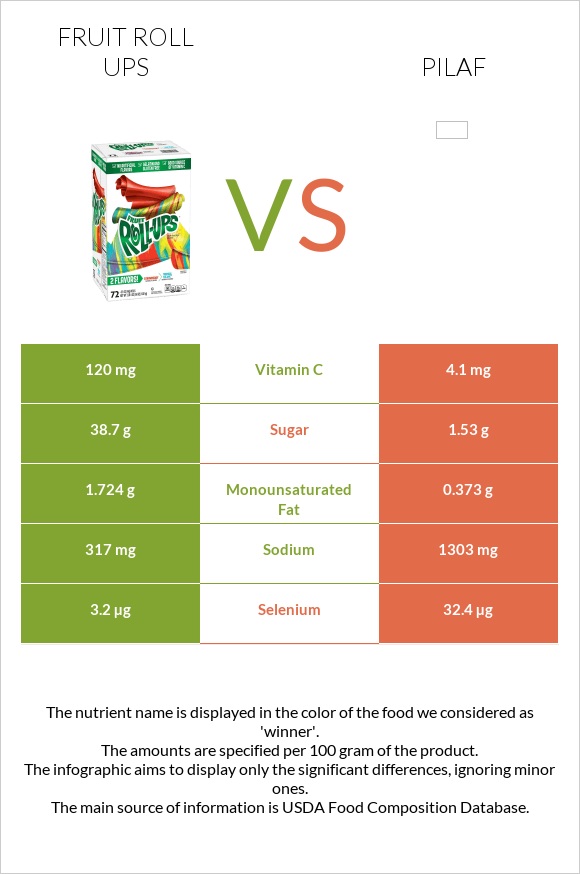
Differences between fruit roll ups and pilaf
- Fruit roll ups have more vitamin C and monounsaturated fat, while pilaf has more selenium.
- Fruit roll ups' daily need coverage for vitamin C is 129% higher.
- Pilaf contains 25 times less sugar than fruit roll ups. Fruit roll ups contain 38.7g of sugar, while pilaf contains 1.53g.
- Pilaf has a lower glycemic index. The glycemic index of pilaf is 60, while the glycemic index of fruit roll ups is 99.
The food types used in this comparison are Snacks, GENERAL MILLS, BETTY CROCKER Fruit Roll Ups, berry flavored, with vitamin C and Rice and vermicelli mix, rice pilaf flavor, unprepared.
Infographic
Infographic link
Mineral Comparison
Mineral comparison score is based on the number of minerals by which one or the other food is richer. The "coverage" charts below show how much of the daily needs can be covered by 300 grams of the food.
| Contains less SodiumSodium | -75.7% |
| Contains more SeleniumSelenium | +912.5% |
Vitamin Comparison
Vitamin comparison score is based on the number of vitamins by which one or the other food is richer. The "coverage" charts below show how much of the daily needs can be covered by 300 grams of the food.
| Contains more Vitamin CVitamin C | +2826.8% |
All nutrients comparison - raw data values
| Nutrient |  |
 |
DV% diff. |
| Vitamin C | 120mg | 4.1mg | 129% |
| Selenium | 3.2µg | 32.4µg | 53% |
| Folate | 212µg | 53% | |
| Vitamin B1 | 0.603mg | 50% | |
| Sodium | 317mg | 1303mg | 43% |
| Manganese | 0.882mg | 38% | |
| Vitamin B3 | 6.127mg | 38% | |
| Iron | 2.44mg | 31% | |
| Vitamin B6 | 0.4mg | 31% | |
| Starch | 71.23g | 29% | |
| Phosphorus | 154mg | 22% | |
| Protein | 0.1g | 10.42g | 21% |
| Copper | 0.166mg | 18% | |
| Vitamin B5 | 0.715mg | 14% | |
| Zinc | 1.01mg | 9% | |
| Magnesium | 32mg | 8% | |
| Calcium | 83mg | 8% | |
| Vitamin B2 | 0.087mg | 7% | |
| Potassium | 188mg | 6% | |
| Fiber | 1.2g | 5% | |
| Fats | 3.5g | 1.37g | 3% |
| Carbs | 85.2g | 76.31g | 3% |
| Choline | 17.5mg | 3% | |
| Saturated fat | 0.99g | 0.307g | 3% |
| Monounsaturated fat | 1.724g | 0.373g | 3% |
| Polyunsaturated fat | 0.093g | 0.377g | 2% |
| Calories | 373kcal | 359kcal | 1% |
| Vitamin B12 | 0.02µg | 1% | |
| Protein per 100 calories | 0.03g | 2.9g | N/A |
| Calories per 10 g protein | 37300kcal | 345kcal | N/A |
| Weight per 100 calories | 27g | 28g | N/A |
| Unsaturated / Saturated Fat ratio | 1.8 | 2.4 | N/A |
| Net carbs | 85.2g | 75.11g | N/A |
| Cholesterol | 1mg | 0% | |
| Sugar | 38.7g | 1.53g | N/A |
| Vitamin A | 4µg | 0% | |
| Vitamin E | 0.04mg | 0% | |
| Vitamin K | 0.5µg | 0% | |
| Tryptophan | 0.086mg | 0% | |
| Threonine | 0.221mg | 0% | |
| Isoleucine | 0.279mg | 0% | |
| Leucine | 0.523mg | 0% | |
| Lysine | 0.189mg | 0% | |
| Methionine | 0.145mg | 0% | |
| Phenylalanine | 0.32mg | 0% | |
| Valine | 0.374mg | 0% | |
| Histidine | 0.15mg | 0% |
Macronutrient Comparison
Macronutrient breakdown side-by-side comparison
Protein:
0.1 g
Fats:
3.5 g
Carbs:
85.2 g
Water:
10.2 g
Other:
1 g
Protein:
10.42 g
Fats:
1.37 g
Carbs:
76.31 g
Water:
8.04 g
Other:
3.86 g
| Contains more FatsFats | +155.5% |
| Contains more CarbsCarbs | +11.6% |
| Contains more WaterWater | +26.9% |
| Contains more ProteinProtein | +10320% |
| Contains more OtherOther | +286% |
Fat Type Comparison
Fat type breakdown side-by-side comparison
Saturated fat:
Sat. Fat
0.99 g
Monounsaturated fat:
Mono. Fat
1.724 g
Polyunsaturated fat:
Poly. Fat
0.093 g
Saturated fat:
Sat. Fat
0.307 g
Monounsaturated fat:
Mono. Fat
0.373 g
Polyunsaturated fat:
Poly. Fat
0.377 g
| Contains more Mono. FatMonounsaturated fat | +362.2% |
| Contains less Sat. FatSaturated fat | -69% |
| Contains more Poly. FatPolyunsaturated fat | +305.4% |


