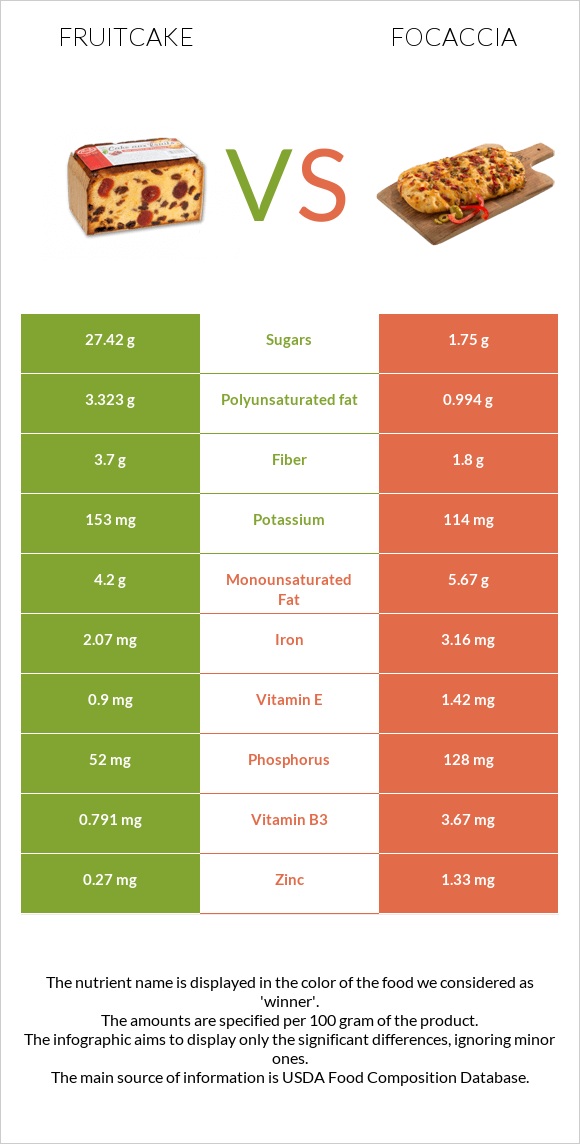
Summary of differences between fruitcake and focaccia The amount of vitamin B1, folate, selenium, vitamin B3, vitamin B2, iron, phosphorus, zinc, and vitamin B5 in focaccia is higher than in fruitcake. Focaccia covers your daily need for vitamin B1, 35% more than fruitcake. The amount of sodium in fruitcake is lower. These are the specific foods used in this comparison Cake, fruitcake, commercially prepared and Focaccia, Italian flatbread, plain .
Infographic
Mineral Comparison
Mineral comparison score is based on the number of minerals by which one or the other food is richer. The "coverage" charts below show how much of the daily needs can be covered by 300 grams of the food.
2
100 g
300 g
1 oz - 28.35g 1 piece - 43g
Magnesium
Magnesium
Calcium
Calcium
Potassium
Potassium
Iron
Iron
Copper
Copper
Zinc
Zinc
Phosphorus
Phosphorus
Sodium
Sodium
Manganese
Manganese
Selenium
Selenium
11%
9.9%
14%
78%
17%
7.4%
22%
13%
29%
11%
7
100 g
300 g
1 piece - 57g
Magnesium
Magnesium
Calcium
Calcium
Potassium
Potassium
Iron
Iron
Copper
Copper
Zinc
Zinc
Phosphorus
Phosphorus
Sodium
Sodium
Manganese
Manganese
Selenium
Selenium
14%
11%
10%
119%
30%
36%
55%
73%
47%
87%
Vitamin Comparison
Vitamin comparison score is based on the number of vitamins by which one or the other food is richer. The "coverage" charts below show how much of the daily needs can be covered by 300 grams of the food.
3
100 g
300 g
1 oz - 28.35g 1 piece - 43g
Vitamin C
Vit. C
Vitamin D
Vit. D
Vitamin A
Vit. A
Vitamin E
Vit. E
Vitamin B1
Vit. B1
Vitamin B2
Vit. B2
Vitamin B3
Vit. B3
Vitamin B5
Vit. B5
Vitamin B6
Vit. B6
Vitamin B12
Vit. B12
Vitamin K
Vit. K
Folate
Folate
1.7%
0%
2.3%
18%
13%
23%
15%
14%
11%
1.3%
3.8%
15%
8
100 g
300 g
1 piece - 57g
Vitamin C
Vit. C
Vitamin D
Vit. D
Vitamin A
Vit. A
Vitamin E
Vit. E
Vitamin B1
Vit. B1
Vitamin B2
Vit. B2
Vitamin B3
Vit. B3
Vitamin B5
Vit. B5
Vitamin B6
Vit. B6
Vitamin B12
Vit. B12
Vitamin K
Vit. K
Folate
Folate
0%
0%
0%
28%
118%
69%
69%
39%
26%
0%
14%
104%
All nutrients comparison - raw data values
Nutrient
DV% diff.
Vitamin B1
0.05mg
0.47mg
35%
Folate
20µg
138µg
30%
Selenium
2µg
15.9µg
25%
Sodium
101mg
561mg
20%
Vitamin B3
0.791mg
3.67mg
18%
Vitamin B2
0.099mg
0.301mg
16%
Polyunsaturated fat
3.323g
0.994g
16%
Iron
2.07mg
3.16mg
14%
Protein
2.9g
8.77g
12%
Phosphorus
52mg
128mg
11%
Zinc
0.27mg
1.33mg
10%
Carbs
61.6g
35.82g
9%
Fiber
3.7g
1.8g
8%
Vitamin B5
0.226mg
0.645mg
8%
Manganese
0.22mg
0.364mg
6%
Copper
0.05mg
0.091mg
5%
Vitamin B6
0.046mg
0.113mg
5%
Calories
324kcal
249kcal
4%
Vitamin K
1.5µg
5.7µg
4%
Monounsaturated fat
4.2g
5.67g
4%
Vitamin E
0.9mg
1.42mg
3%
Fats
9.1g
7.89g
2%
Cholesterol
5mg
0mg
2%
Vitamin C
0.5mg
0mg
1%
Magnesium
16mg
20mg
1%
Potassium
153mg
114mg
1%
Vitamin A
7µg
0µg
1%
Choline
8.9mg
2.9mg
1%
Saturated fat
1.048g
0.877g
1%
Protein per 100 calories
0.9g
3.5g
N/A
Calories per 10 g protein
1117kcal
284kcal
N/A
Weight per 100 calories
31g
40g
N/A
Unsaturated / Saturated Fat ratio
7.2
7.6
N/A
Net carbs
57.9g
34.02g
N/A
Calcium
33mg
35mg
0%
Sugar
27.42g
1.75g
N/A
Vitamin B12
0.01µg
0µg
0%
Tryptophan
0.042mg
0%
Threonine
0.102mg
0%
Isoleucine
0.121mg
0%
Leucine
0.206mg
0%
Lysine
0.121mg
0%
Methionine
0.059mg
0%
Phenylalanine
0.14mg
0%
Valine
0.144mg
0%
Histidine
0.071mg
0%
Omega-3 - DHA
0.001g
0g
N/A
Macronutrient Comparison
Macronutrient breakdown side-by-side comparison
2
3%
9%
62%
25%
Protein:
2.9 g
Fats:
9.1 g
Carbs:
61.6 g
Water:
25.3 g
Other:
1.1 g
3
9%
8%
36%
46%
Protein:
8.77 g
Fats:
7.89 g
Carbs:
35.82 g
Water:
45.91 g
Other:
1.61 g
Contains
more
Fats Fats
+15.3%
Contains
more
Carbs Carbs
+72%
Contains
more
Protein Protein
+202.4%
Contains
more
Water Water
+81.5%
Contains
more
Other Other
+46.4%
Fat Type Comparison
Fat type breakdown side-by-side comparison
1
12%
49%
39%
Saturated fat:
Sat. Fat
1.048 g
Monounsaturated fat:
Mono. Fat
4.2 g
Polyunsaturated fat:
Poly. Fat
3.323 g
2
12%
75%
13%
Saturated fat:
Sat. Fat
0.877 g
Monounsaturated fat:
Mono. Fat
5.67 g
Polyunsaturated fat:
Poly. Fat
0.994 g
Contains
more
Poly. Fat Polyunsaturated fat
+234.3%
Contains
less
Sat. Fat Saturated fat
-16.3%
Contains
more
Mono. Fat Monounsaturated fat
+35%