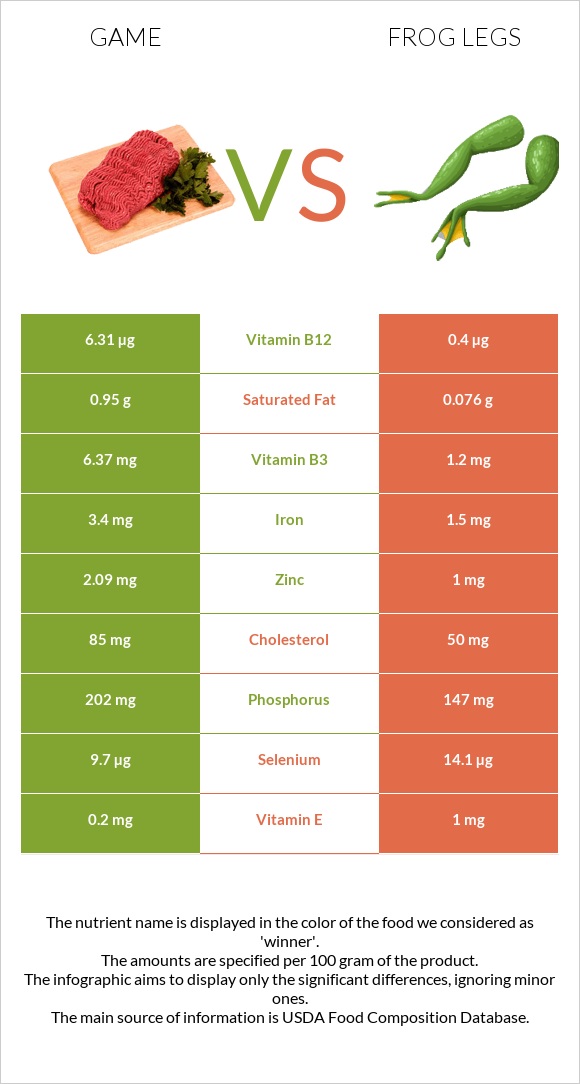
A recap on the differences between game and frog legs Frog legs have less vitamin B2, iron, vitamin B1, phosphorus, and zinc. Game covers your daily vitamin B2 needs 37% more than frog legs. Frog legs contain 13 times less saturated fat than game. Game contains 0.97g of saturated fat, while frog legs contain 0.076g. Food varieties used in this article are Game meat, antelope, cooked, roasted and Frog legs, raw .
Infographic
Mineral Comparison
Mineral comparison score is based on the number of minerals by which one or the other food is richer. The "coverage" charts below show how much of the daily needs can be covered by 300 grams of the food.
6
100 g
300 g
3 oz - 85g 1 piece, cooked (yield from 1 lb raw meat, boneless) - 340g
Magnesium
Magnesium
Calcium
Calcium
Potassium
Potassium
Iron
Iron
Copper
Copper
Zinc
Zinc
Phosphorus
Phosphorus
Sodium
Sodium
Manganese
Manganese
Selenium
Selenium
20%
1.2%
33%
158%
71%
46%
90%
7%
2.9%
70%
2
100 g
300 g
1 leg - 45g
Magnesium
Magnesium
Calcium
Calcium
Potassium
Potassium
Iron
Iron
Copper
Copper
Zinc
Zinc
Phosphorus
Phosphorus
Sodium
Sodium
Manganese
Manganese
Selenium
Selenium
14%
5.4%
25%
56%
83%
27%
63%
7.6%
0%
77%
Vitamin Comparison
Vitamin comparison score is based on the number of vitamins by which one or the other food is richer. The "coverage" charts below show how much of the daily needs can be covered by 300 grams of the food.
2
100 g
300 g
3 oz - 85g 1 piece, cooked (yield from 1 lb raw meat, boneless) - 340g
Vitamin C
Vit. C
Vitamin D
Vit. D
Vitamin A
Vit. A
Vitamin E
Vit. E
Vitamin B1
Vit. B1
Vitamin B2
Vit. B2
Vitamin B3
Vit. B3
Vitamin B5
Vit. B5
Vitamin B6
Vit. B6
Vitamin B12
Vit. B12
Vitamin K
Vit. K
Folate
Folate
0%
0%
0%
0%
65%
168%
0%
0%
0%
0%
0%
6.8%
8
100 g
300 g
1 leg - 45g
Vitamin C
Vit. C
Vitamin D
Vit. D
Vitamin A
Vit. A
Vitamin E
Vit. E
Vitamin B1
Vit. B1
Vitamin B2
Vit. B2
Vitamin B3
Vit. B3
Vitamin B5
Vit. B5
Vitamin B6
Vit. B6
Vitamin B12
Vit. B12
Vitamin K
Vit. K
Folate
Folate
0%
3%
5%
20%
35%
58%
23%
0%
28%
50%
0.25%
11%
All nutrients comparison - raw data values
Nutrient
DV% diff.
Vitamin B2
0.73mg
0.25mg
37%
Iron
4.2mg
1.5mg
34%
Protein
29.45g
16.4g
26%
Cholesterol
126mg
50mg
25%
Vitamin B12
0.4µg
17%
Choline
65mg
12%
Vitamin B1
0.26mg
0.14mg
10%
Phosphorus
210mg
147mg
9%
Vitamin B6
0.12mg
9%
Vitamin B3
1.2mg
8%
Vitamin E
1mg
7%
Zinc
1.68mg
1mg
6%
Calories
150kcal
73kcal
4%
Fats
2.67g
0.3g
4%
Copper
0.213mg
0.25mg
4%
Saturated fat
0.97g
0.076g
4%
Potassium
372mg
285mg
3%
Polyunsaturated fat
0.58g
0.102g
3%
Magnesium
28mg
20mg
2%
Vitamin A
15µg
2%
Selenium
12.9µg
14.1µg
2%
Folate
9µg
15µg
2%
Vitamin D*
8 IU
1%
Vitamin D
0.2µg
1%
Calcium
4mg
18mg
1%
Manganese
0.022mg
1%
Monounsaturated fat
0.63g
0.053g
1%
Protein per 100 calories
20g
22g
N/A
Calories per 10 g protein
51kcal
45kcal
N/A
Weight per 100 calories
67g
137g
N/A
Unsaturated / Saturated Fat ratio
1.2
2
N/A
Sodium
54mg
58mg
0%
Vitamin K
0.1µg
0%
Threonine
1.362mg
0%
Isoleucine
1.126mg
0%
Leucine
2.489mg
0%
Lysine
2.462mg
0%
Methionine
0.838mg
0%
Phenylalanine
1.166mg
0%
Valine
1.31mg
0%
Histidine
1.401mg
0%
Omega-3 - EPA
0.014g
N/A
Omega-3 - DHA
0.02g
N/A
Omega-3 - DPA
0.007g
N/A
Macronutrient Comparison
Macronutrient breakdown side-by-side comparison
3
29%
3%
66%
2%
Protein:
29.45 g
Fats:
2.67 g
Carbs:
0 g
Water:
65.9 g
Other:
1.98 g
1
16%
82%
Protein:
16.4 g
Fats:
0.3 g
Carbs:
0 g
Water:
81.9 g
Other:
1.4 g
Contains
more
Protein Protein
+79.6%
Contains
more
Fats Fats
+790%
Contains
more
Other Other
+41.4%
Contains
more
Water Water
+24.3%
Fat Type Comparison
Fat type breakdown side-by-side comparison
2
44%
29%
27%
Saturated fat:
Sat. Fat
0.97 g
Monounsaturated fat:
Mono. Fat
0.63 g
Polyunsaturated fat:
Poly. Fat
0.58 g
1
33%
23%
44%
Saturated fat:
Sat. Fat
0.076 g
Monounsaturated fat:
Mono. Fat
0.053 g
Polyunsaturated fat:
Poly. Fat
0.102 g
Contains
more
Mono. Fat Monounsaturated fat
+1088.7%
Contains
more
Poly. Fat Polyunsaturated fat
+468.6%
Contains
less
Sat. Fat Saturated fat
-92.2%