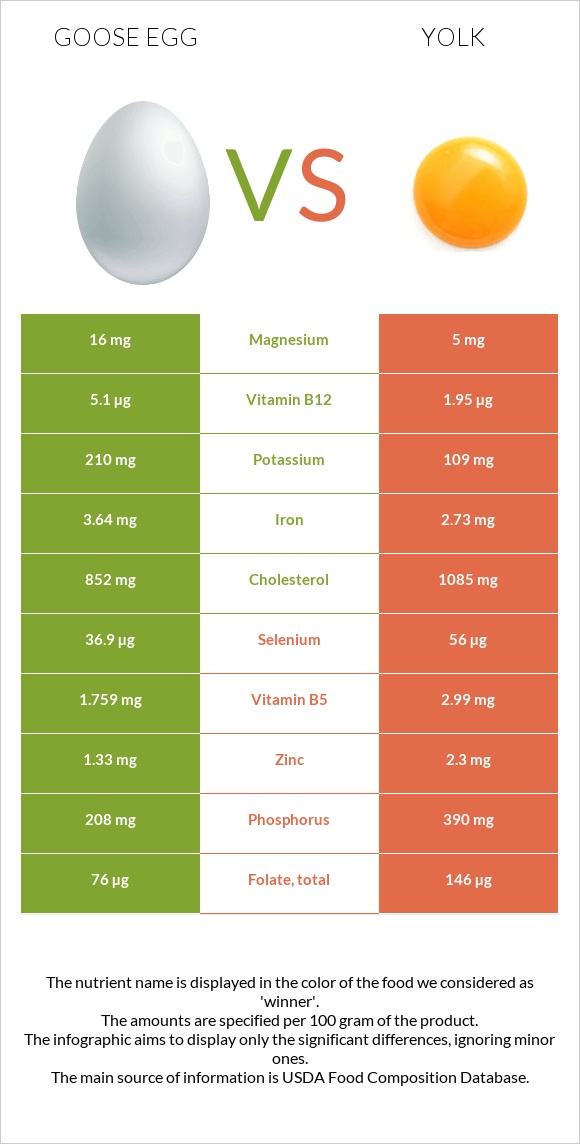
The main differences between goose eggs and yolk Goose eggs are richer in vitamin B12, yet yolk is richer in choline, selenium, phosphorus, vitamin B5, vitamin D*, folate, and vitamin A. Daily need coverage for vitamin B12 for goose eggs is 131% higher. Food types used in this article are Egg, goose, whole, fresh, raw and Egg, yolk, raw, fresh .
Infographic
Mineral Comparison
Mineral comparison score is based on the number of minerals by which one or the other food is richer. The "coverage" charts below show how much of the daily needs can be covered by 300 grams of the food.
3
100 g
300 g
1 egg - 144g
Magnesium
Magnesium
Calcium
Calcium
Potassium
Potassium
Iron
Iron
Copper
Copper
Zinc
Zinc
Phosphorus
Phosphorus
Sodium
Sodium
Manganese
Manganese
Selenium
Selenium
11%
18%
19%
137%
21%
36%
89%
18%
5%
201%
7
100 g
300 g
1 large - 17g 1 cup - 243g
Magnesium
Magnesium
Calcium
Calcium
Potassium
Potassium
Iron
Iron
Copper
Copper
Zinc
Zinc
Phosphorus
Phosphorus
Sodium
Sodium
Manganese
Manganese
Selenium
Selenium
3.6%
39%
9.6%
102%
26%
63%
167%
6.3%
7.2%
305%
Vitamin Comparison
Vitamin comparison score is based on the number of vitamins by which one or the other food is richer. The "coverage" charts below show how much of the daily needs can be covered by 300 grams of the food.
2
100 g
300 g
1 egg - 144g
Vitamin C
Vit. C
Vitamin D
Vit. D
Vitamin A
Vit. A
Vitamin E
Vit. E
Vitamin B1
Vit. B1
Vitamin B2
Vit. B2
Vitamin B3
Vit. B3
Vitamin B5
Vit. B5
Vitamin B6
Vit. B6
Vitamin B12
Vit. B12
Vitamin K
Vit. K
Folate
Folate
0%
26%
62%
26%
37%
88%
3.5%
106%
54%
638%
1%
57%
9
100 g
300 g
1 large - 17g 1 cup - 243g
Vitamin C
Vit. C
Vitamin D
Vit. D
Vitamin A
Vit. A
Vitamin E
Vit. E
Vitamin B1
Vit. B1
Vitamin B2
Vit. B2
Vitamin B3
Vit. B3
Vitamin B5
Vit. B5
Vitamin B6
Vit. B6
Vitamin B12
Vit. B12
Vitamin K
Vit. K
Folate
Folate
0%
81%
127%
52%
44%
122%
0.45%
179%
81%
244%
1.8%
110%
All nutrients comparison - raw data values
Nutrient
DV% diff.
Vitamin B12
5.1µg
1.95µg
131%
Choline
263.4mg
820.2mg
101%
Cholesterol
852mg
1085mg
78%
Selenium
36.9µg
56µg
35%
Saturated fat
3.595g
9.551g
27%
Phosphorus
208mg
390mg
26%
Vitamin B5
1.759mg
2.99mg
25%
Vitamin A
187µg
381µg
22%
Fats
13.27g
26.54g
20%
Vitamin D*
66 IU
218 IU
19%
Vitamin D
1.7µg
5.4µg
19%
Folate
76µg
146µg
18%
Polyunsaturated fat
1.672g
4.204g
17%
Monounsaturated fat
5.747g
11.738g
15%
Iron
3.64mg
2.73mg
11%
Vitamin B2
0.382mg
0.528mg
11%
Zinc
1.33mg
2.3mg
9%
Vitamin E
1.29mg
2.58mg
9%
Vitamin B6
0.236mg
0.35mg
9%
Calories
185kcal
322kcal
7%
Calcium
60mg
129mg
7%
Protein
13.87g
15.86g
4%
Sodium
138mg
48mg
4%
Magnesium
16mg
5mg
3%
Potassium
210mg
109mg
3%
Copper
0.062mg
0.077mg
2%
Vitamin B1
0.147mg
0.176mg
2%
Carbs
1.35g
3.59g
1%
Manganese
0.038mg
0.055mg
1%
Vitamin B3
0.189mg
0.024mg
1%
Protein per 100 calories
7.5g
4.9g
N/A
Calories per 10 g protein
133kcal
203kcal
N/A
Weight per 100 calories
54g
31g
N/A
Unsaturated / Saturated Fat ratio
2.1
1.7
N/A
Net carbs
1.35g
3.59g
N/A
Sugar
0.94g
0.56g
N/A
Vitamin K
0.4µg
0.7µg
0%
Tryptophan
0.282mg
0.177mg
0%
Threonine
0.797mg
0.687mg
0%
Isoleucine
0.647mg
0.866mg
0%
Leucine
1.188mg
1.399mg
0%
Lysine
1.03mg
1.217mg
0%
Methionine
0.624mg
0.378mg
0%
Phenylalanine
0.91mg
0.681mg
0%
Valine
0.958mg
0.949mg
0%
Histidine
0.346mg
0.416mg
0%
Fructose
0.07g
0%
Omega-3 - EPA
0g
0.011g
N/A
Omega-3 - DHA
0g
0.114g
N/A
Macronutrient Comparison
Macronutrient breakdown side-by-side comparison
1
14%
13%
70%
Protein:
13.87 g
Fats:
13.27 g
Carbs:
1.35 g
Water:
70.43 g
Other:
1.08 g
4
16%
27%
4%
52%
2%
Protein:
15.86 g
Fats:
26.54 g
Carbs:
3.59 g
Water:
52.31 g
Other:
1.7 g
Contains
more
Water Water
+34.6%
Contains
more
Protein Protein
+14.3%
Contains
more
Fats Fats
+100%
Contains
more
Carbs Carbs
+165.9%
Contains
more
Other Other
+57.4%
Fat Type Comparison
Fat type breakdown side-by-side comparison
1
33%
52%
15%
Saturated fat:
Sat. Fat
3.595 g
Monounsaturated fat:
Mono. Fat
5.747 g
Polyunsaturated fat:
Poly. Fat
1.672 g
2
37%
46%
16%
Saturated fat:
Sat. Fat
9.551 g
Monounsaturated fat:
Mono. Fat
11.738 g
Polyunsaturated fat:
Poly. Fat
4.204 g
Contains
less
Sat. Fat Saturated fat
-62.4%
Contains
more
Mono. Fat Monounsaturated fat
+104.2%
Contains
more
Poly. Fat Polyunsaturated fat
+151.4%