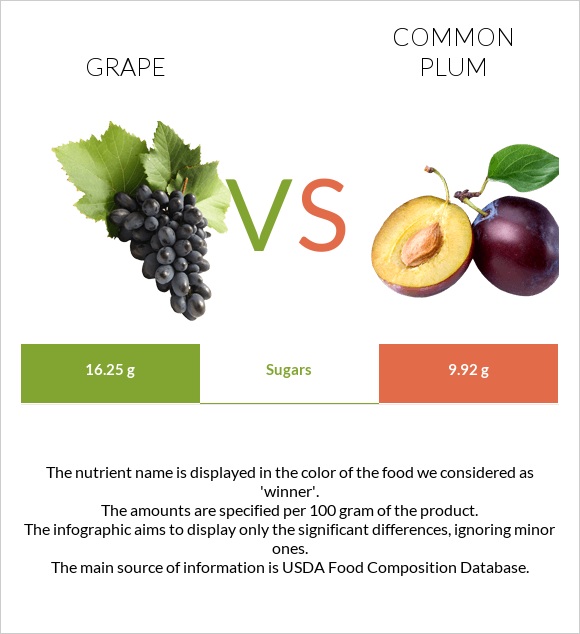
Significant differences between grapes and plums Grapes have more manganese, vitamin K, vitamin B6, and vitamin B1; however, plums are richer in vitamin C. Grapes cover your daily manganese needs 29% more than plums. Plums have 4 times less vitamin B6 than grapes. Grapes have 0.11mg of vitamin B6, while plums have 0.029mg. Plums contain less sugar. Specific food types used in this comparison are Grapes, american type (slip skin), raw and Plums, raw .
Infographic
Mineral Comparison
Mineral comparison score is based on the number of minerals by which one or the other food is richer. The "coverage" charts below show how much of the daily needs can be covered by 300 grams of the food.
5
100 g
300 g
1 grape - 2.4g 1 cup - 92g
Magnesium
Magnesium
Calcium
Calcium
Potassium
Potassium
Iron
Iron
Copper
Copper
Zinc
Zinc
Phosphorus
Phosphorus
Sodium
Sodium
Manganese
Manganese
Selenium
Selenium
3.6%
4.2%
17%
11%
13%
1.1%
4.3%
0.26%
94%
0.55%
5
100 g
300 g
1 fruit (2-1/8" dia) - 66g 1 NLEA serving - 151g 1 cup, sliced - 165g
Magnesium
Magnesium
Calcium
Calcium
Potassium
Potassium
Iron
Iron
Copper
Copper
Zinc
Zinc
Phosphorus
Phosphorus
Sodium
Sodium
Manganese
Manganese
Selenium
Selenium
5%
1.8%
14%
6.4%
19%
2.7%
6.9%
0%
6.8%
0%
Vitamin Comparison
Vitamin comparison score is based on the number of vitamins by which one or the other food is richer. The "coverage" charts below show how much of the daily needs can be covered by 300 grams of the food.
4
100 g
300 g
1 grape - 2.4g 1 cup - 92g
Vitamin C
Vit. C
Vitamin D
Vit. D
Vitamin A
Vit. A
Vitamin E
Vit. E
Vitamin B1
Vit. B1
Vitamin B2
Vit. B2
Vitamin B3
Vit. B3
Vitamin B5
Vit. B5
Vitamin B6
Vit. B6
Vitamin B12
Vit. B12
Vitamin K
Vit. K
Folate
Folate
13%
0%
1.7%
3.8%
23%
13%
5.6%
1.4%
25%
0%
37%
3%
6
100 g
300 g
1 fruit (2-1/8" dia) - 66g 1 NLEA serving - 151g 1 cup, sliced - 165g
Vitamin C
Vit. C
Vitamin D
Vit. D
Vitamin A
Vit. A
Vitamin E
Vit. E
Vitamin B1
Vit. B1
Vitamin B2
Vit. B2
Vitamin B3
Vit. B3
Vitamin B5
Vit. B5
Vitamin B6
Vit. B6
Vitamin B12
Vit. B12
Vitamin K
Vit. K
Folate
Folate
32%
0%
5.7%
5.2%
7%
6%
7.8%
8.1%
6.7%
0%
16%
3.8%
All nutrients comparison - raw data values
Nutrient
DV% diff.
Manganese
0.718mg
0.052mg
29%
Vitamin K
14.6µg
6.4µg
7%
Vitamin C
4mg
9.5mg
6%
Vitamin B6
0.11mg
0.029mg
6%
Vitamin B1
0.092mg
0.028mg
5%
Fructose
3.07g
4%
Carbs
17.15g
11.42g
2%
Iron
0.29mg
0.17mg
2%
Fiber
0.9g
1.4g
2%
Copper
0.04mg
0.057mg
2%
Vitamin B2
0.057mg
0.026mg
2%
Vitamin B5
0.024mg
0.135mg
2%
Calories
67kcal
46kcal
1%
Calcium
14mg
6mg
1%
Potassium
191mg
157mg
1%
Zinc
0.04mg
0.1mg
1%
Phosphorus
10mg
16mg
1%
Vitamin A
5µg
17µg
1%
Vitamin B3
0.3mg
0.417mg
1%
Choline
5.6mg
1.9mg
1%
Protein
0.63g
0.7g
0%
Protein per 100 calories
0.94g
1.5g
N/A
Calories per 10 g protein
1063kcal
657kcal
N/A
Weight per 100 calories
149g
217g
N/A
Fats
0.35g
0.28g
0%
Net carbs
16.25g
10.02g
N/A
Magnesium
5mg
7mg
0%
Sugar
16.25g
9.92g
N/A
Sodium
2mg
0mg
0%
Vitamin E
0.19mg
0.26mg
0%
Selenium
0.1µg
0µg
0%
Folate
4µg
5µg
0%
Saturated fat
0.114g
0.017g
0%
Monounsaturated fat
0.014g
0.134g
0%
Polyunsaturated fat
0.102g
0.044g
0%
Tryptophan
0.003mg
0.009mg
0%
Threonine
0.017mg
0.01mg
0%
Isoleucine
0.005mg
0.014mg
0%
Leucine
0.013mg
0.015mg
0%
Lysine
0.014mg
0.016mg
0%
Methionine
0.021mg
0.008mg
0%
Phenylalanine
0.013mg
0.014mg
0%
Valine
0.017mg
0.016mg
0%
Histidine
0.023mg
0.009mg
0%
Macronutrient Comparison
Macronutrient breakdown side-by-side comparison
3
17%
81%
Protein:
0.63 g
Fats:
0.35 g
Carbs:
17.15 g
Water:
81.3 g
Other:
0.57 g
2
11%
87%
Protein:
0.7 g
Fats:
0.28 g
Carbs:
11.42 g
Water:
87.23 g
Other:
0.37 g
Contains
more
Fats Fats
+25%
Contains
more
Carbs Carbs
+50.2%
Contains
more
Other Other
+54.1%
Contains
more
Protein Protein
+11.1%
Fat Type Comparison
Fat type breakdown side-by-side comparison
1
50%
6%
44%
Saturated fat:
Sat. Fat
0.114 g
Monounsaturated fat:
Mono. Fat
0.014 g
Polyunsaturated fat:
Poly. Fat
0.102 g
2
9%
69%
23%
Saturated fat:
Sat. Fat
0.017 g
Monounsaturated fat:
Mono. Fat
0.134 g
Polyunsaturated fat:
Poly. Fat
0.044 g
Contains
more
Poly. Fat Polyunsaturated fat
+131.8%
Contains
less
Sat. Fat Saturated fat
-85.1%
Contains
more
Mono. Fat Monounsaturated fat
+857.1%