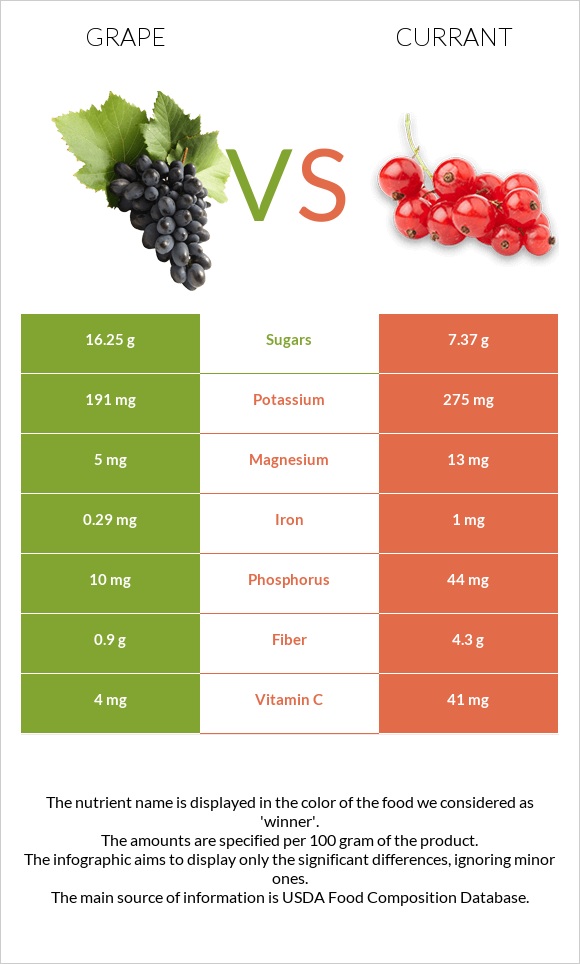
A recap on the differences between grapes and currants Grapes have more manganese; however, currants are higher in vitamin C, fiber, iron, and copper. Currants cover your daily vitamin C needs 41% more than grapes. Currants contain 4 times less manganese than grapes. Grapes contain 0.718mg of manganese, while currants contain 0.186mg. Currants have less sugar. The glycemic index of grapes is higher. Food varieties used in this article are Grapes, american type (slip skin), raw and Currants, red, and white, raw .
Infographic
Mineral Comparison
Mineral comparison score is based on the number of minerals by which one or the other food is richer. The "coverage" charts below show how much of the daily needs can be covered by 300 grams of the food.
1
100 g
300 g
1 grape - 2.4g 1 cup - 92g
Magnesium
Magnesium
Calcium
Calcium
Potassium
Potassium
Iron
Iron
Copper
Copper
Zinc
Zinc
Phosphorus
Phosphorus
Sodium
Sodium
Manganese
Manganese
Selenium
Selenium
3.6%
4.2%
17%
11%
13%
1.1%
4.3%
0.26%
94%
0.55%
9
100 g
300 g
1 cup - 112g
Magnesium
Magnesium
Calcium
Calcium
Potassium
Potassium
Iron
Iron
Copper
Copper
Zinc
Zinc
Phosphorus
Phosphorus
Sodium
Sodium
Manganese
Manganese
Selenium
Selenium
9.3%
9.9%
24%
38%
36%
6.3%
19%
0.13%
24%
3.3%
Vitamin Comparison
Vitamin comparison score is based on the number of vitamins by which one or the other food is richer. The "coverage" charts below show how much of the daily needs can be covered by 300 grams of the food.
7
100 g
300 g
1 grape - 2.4g 1 cup - 92g
Vitamin C
Vit. C
Vitamin D
Vit. D
Vitamin A
Vit. A
Vitamin E
Vit. E
Vitamin B1
Vit. B1
Vitamin B2
Vit. B2
Vitamin B3
Vit. B3
Vitamin B5
Vit. B5
Vitamin B6
Vit. B6
Vitamin B12
Vit. B12
Vitamin K
Vit. K
Folate
Folate
13%
0%
1.7%
3.8%
23%
13%
5.6%
1.4%
25%
0%
37%
3%
3
100 g
300 g
1 cup - 112g
Vitamin C
Vit. C
Vitamin D
Vit. D
Vitamin A
Vit. A
Vitamin E
Vit. E
Vitamin B1
Vit. B1
Vitamin B2
Vit. B2
Vitamin B3
Vit. B3
Vitamin B5
Vit. B5
Vitamin B6
Vit. B6
Vitamin B12
Vit. B12
Vitamin K
Vit. K
Folate
Folate
137%
0%
0.67%
2%
10%
12%
1.9%
3.8%
16%
0%
28%
6%
All nutrients comparison - raw data values
Nutrient
DV% diff.
Vitamin C
4mg
41mg
41%
Manganese
0.718mg
0.186mg
23%
Fiber
0.9g
4.3g
14%
Iron
0.29mg
1mg
9%
Copper
0.04mg
0.107mg
7%
Phosphorus
10mg
44mg
5%
Vitamin B1
0.092mg
0.04mg
4%
Fructose
3.53g
4%
Vitamin B6
0.11mg
0.07mg
3%
Vitamin K
14.6µg
11µg
3%
Protein
0.63g
1.4g
2%
Magnesium
5mg
13mg
2%
Calcium
14mg
33mg
2%
Potassium
191mg
275mg
2%
Zinc
0.04mg
0.23mg
2%
Calories
67kcal
56kcal
1%
Carbs
17.15g
13.8g
1%
Vitamin E
0.19mg
0.1mg
1%
Selenium
0.1µg
0.6µg
1%
Vitamin B2
0.057mg
0.05mg
1%
Vitamin B3
0.3mg
0.1mg
1%
Vitamin B5
0.024mg
0.064mg
1%
Folate
4µg
8µg
1%
Protein per 100 calories
0.94g
2.5g
N/A
Calories per 10 g protein
1063kcal
400kcal
N/A
Weight per 100 calories
149g
179g
N/A
Fats
0.35g
0.2g
0%
Net carbs
16.25g
9.5g
N/A
Sugar
16.25g
7.37g
N/A
Sodium
2mg
1mg
0%
Vitamin A
5µg
2µg
0%
Choline
5.6mg
7.6mg
0%
Saturated fat
0.114g
0.017g
0%
Monounsaturated fat
0.014g
0.028g
0%
Polyunsaturated fat
0.102g
0.088g
0%
Tryptophan
0.003mg
0%
Threonine
0.017mg
0%
Isoleucine
0.005mg
0%
Leucine
0.013mg
0%
Lysine
0.014mg
0%
Methionine
0.021mg
0%
Phenylalanine
0.013mg
0%
Valine
0.017mg
0%
Histidine
0.023mg
0%
Macronutrient Comparison
Macronutrient breakdown side-by-side comparison
2
17%
81%
Protein:
0.63 g
Fats:
0.35 g
Carbs:
17.15 g
Water:
81.3 g
Other:
0.57 g
3
14%
84%
Protein:
1.4 g
Fats:
0.2 g
Carbs:
13.8 g
Water:
83.95 g
Other:
0.65 g
Contains
more
Fats Fats
+75%
Contains
more
Carbs Carbs
+24.3%
Contains
more
Protein Protein
+122.2%
Contains
more
Other Other
+14%
Fat Type Comparison
Fat type breakdown side-by-side comparison
1
50%
6%
44%
Saturated fat:
Sat. Fat
0.114 g
Monounsaturated fat:
Mono. Fat
0.014 g
Polyunsaturated fat:
Poly. Fat
0.102 g
2
13%
21%
66%
Saturated fat:
Sat. Fat
0.017 g
Monounsaturated fat:
Mono. Fat
0.028 g
Polyunsaturated fat:
Poly. Fat
0.088 g
Contains
more
Poly. Fat Polyunsaturated fat
+15.9%
Contains
less
Sat. Fat Saturated fat
-85.1%
Contains
more
Mono. Fat Monounsaturated fat
+100%