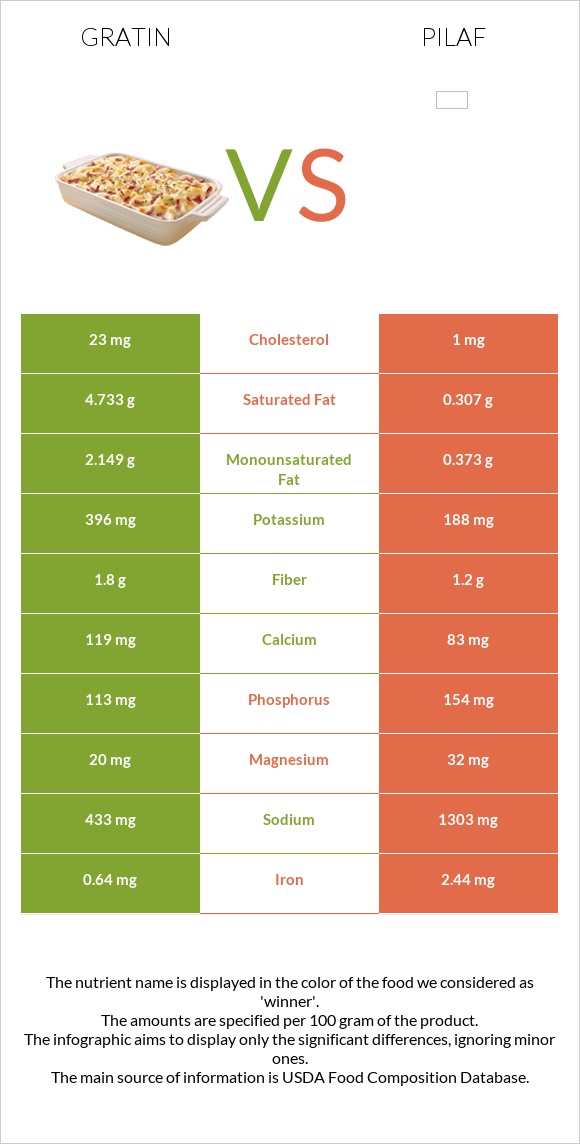
A recap on the differences between gratin and pilaf Gratin has less selenium, folate, vitamin B1, vitamin B3, manganese, iron, and vitamin B6. Pilaf covers your daily selenium needs 54% more than gratin. Pilaf contains 23 times less cholesterol than gratin. Gratin contains 23mg of cholesterol, while pilaf contains 1mg. Food varieties used in this article are Potatoes, au gratin, home-prepared from recipe using butter and Rice and vermicelli mix, rice pilaf flavor, unprepared .
Infographic
Mineral Comparison
Mineral comparison score is based on the number of minerals by which one or the other food is richer. The "coverage" charts below show how much of the daily needs can be covered by 300 grams of the food.
3
100 g
300 g
1 cup - 245g
Magnesium
Magnesium
Calcium
Calcium
Potassium
Potassium
Iron
Iron
Copper
Copper
Zinc
Zinc
Phosphorus
Phosphorus
Sodium
Sodium
Manganese
Manganese
Selenium
Selenium
14%
36%
35%
24%
53%
19%
48%
56%
21%
15%
6
100 g
300 g
1 tbsp - 9.6g 0.333 cup - 68g
Magnesium
Magnesium
Calcium
Calcium
Potassium
Potassium
Iron
Iron
Copper
Copper
Zinc
Zinc
Phosphorus
Phosphorus
Sodium
Sodium
Manganese
Manganese
Selenium
Selenium
23%
25%
17%
92%
55%
28%
66%
170%
115%
177%
Vitamin Comparison
Vitamin comparison score is based on the number of vitamins by which one or the other food is richer. The "coverage" charts below show how much of the daily needs can be covered by 300 grams of the food.
3
100 g
300 g
1 cup - 245g
Vitamin C
Vit. C
Vitamin D
Vit. D
Vitamin A
Vit. A
Vitamin E
Vit. E
Vitamin B1
Vit. B1
Vitamin B2
Vit. B2
Vitamin B3
Vit. B3
Vitamin B5
Vit. B5
Vitamin B6
Vit. B6
Vitamin B12
Vit. B12
Vitamin K
Vit. K
Folate
Folate
33%
0%
21%
0%
16%
27%
19%
23%
40%
0%
0%
8.3%
8
100 g
300 g
1 tbsp - 9.6g 0.333 cup - 68g
Vitamin C
Vit. C
Vitamin D
Vit. D
Vitamin A
Vit. A
Vitamin E
Vit. E
Vitamin B1
Vit. B1
Vitamin B2
Vit. B2
Vitamin B3
Vit. B3
Vitamin B5
Vit. B5
Vitamin B6
Vit. B6
Vitamin B12
Vit. B12
Vitamin K
Vit. K
Folate
Folate
14%
0%
1.3%
0.8%
151%
20%
115%
43%
92%
2.5%
1.3%
159%
All nutrients comparison - raw data values
Nutrient
DV% diff.
Selenium
2.7µg
32.4µg
54%
Folate
11µg
212µg
50%
Vitamin B1
0.064mg
0.603mg
45%
Sodium
433mg
1303mg
38%
Vitamin B3
0.993mg
6.127mg
32%
Manganese
0.161mg
0.882mg
31%
Starch
71.23g
29%
Iron
0.64mg
2.44mg
23%
Carbs
11.27g
76.31g
22%
Saturated fat
4.733g
0.307g
20%
Vitamin B6
0.174mg
0.4mg
17%
Calories
132kcal
359kcal
11%
Protein
5.06g
10.42g
11%
Fats
7.59g
1.37g
10%
Cholesterol
23mg
1mg
7%
Vitamin A
64µg
4µg
7%
Vitamin B5
0.387mg
0.715mg
7%
Vitamin C
9.9mg
4.1mg
6%
Potassium
396mg
188mg
6%
Phosphorus
113mg
154mg
6%
Calcium
119mg
83mg
4%
Monounsaturated fat
2.149g
0.373g
4%
Magnesium
20mg
32mg
3%
Zinc
0.69mg
1.01mg
3%
Choline
17.5mg
3%
Fiber
1.8g
1.2g
2%
Vitamin B2
0.116mg
0.087mg
2%
Copper
0.16mg
0.166mg
1%
Vitamin B12
0µg
0.02µg
1%
Polyunsaturated fat
0.276g
0.377g
1%
Protein per 100 calories
3.8g
2.9g
N/A
Calories per 10 g protein
261kcal
345kcal
N/A
Weight per 100 calories
76g
28g
N/A
Unsaturated / Saturated Fat ratio
0.51
2.4
N/A
Net carbs
9.47g
75.11g
N/A
Sugar
1.53g
N/A
Vitamin E
0.04mg
0%
Vitamin K
0.5µg
0%
Tryptophan
0.07mg
0.086mg
0%
Threonine
0.192mg
0.221mg
0%
Isoleucine
0.284mg
0.279mg
0%
Leucine
0.443mg
0.523mg
0%
Lysine
0.381mg
0.189mg
0%
Methionine
0.117mg
0.145mg
0%
Phenylalanine
0.254mg
0.32mg
0%
Valine
0.325mg
0.374mg
0%
Histidine
0.151mg
0.15mg
0%
Macronutrient Comparison
Macronutrient breakdown side-by-side comparison
2
5%
8%
11%
74%
2%
Protein:
5.06 g
Fats:
7.59 g
Carbs:
11.27 g
Water:
74 g
Other:
2.08 g
3
10%
76%
8%
4%
Protein:
10.42 g
Fats:
1.37 g
Carbs:
76.31 g
Water:
8.04 g
Other:
3.86 g
Contains
more
Fats Fats
+454%
Contains
more
Water Water
+820.4%
Contains
more
Protein Protein
+105.9%
Contains
more
Carbs Carbs
+577.1%
Contains
more
Other Other
+85.6%
Fat Type Comparison
Fat type breakdown side-by-side comparison
1
66%
30%
4%
Saturated fat:
Sat. Fat
4.733 g
Monounsaturated fat:
Mono. Fat
2.149 g
Polyunsaturated fat:
Poly. Fat
0.276 g
2
29%
35%
36%
Saturated fat:
Sat. Fat
0.307 g
Monounsaturated fat:
Mono. Fat
0.373 g
Polyunsaturated fat:
Poly. Fat
0.377 g
Contains
more
Mono. Fat Monounsaturated fat
+476.1%
Contains
less
Sat. Fat Saturated fat
-93.5%
Contains
more
Poly. Fat Polyunsaturated fat
+36.6%