Green tea vs. Cranberry juice — In-Depth Nutrition Comparison
Compare
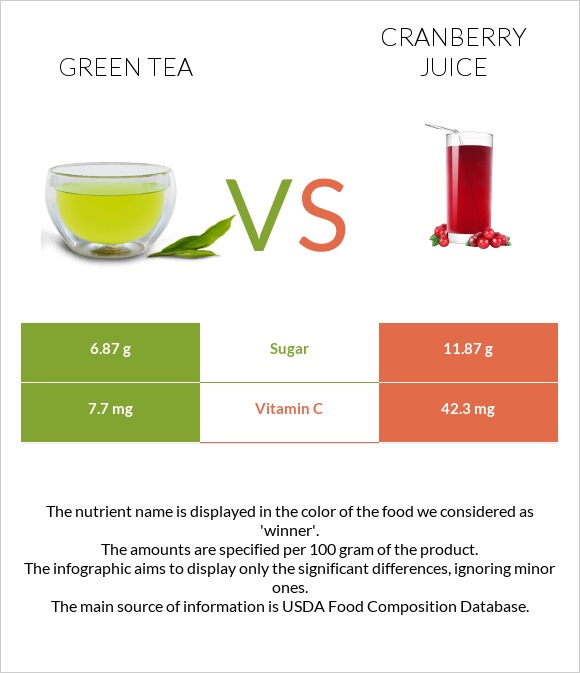
Significant differences between green tea and cranberry juice
- The amount of vitamin C in cranberry juice is higher than in green tea.
- Cranberry juice covers your daily vitamin C needs 38% more than green tea.
Specific food types used in this comparison are Beverages, tea, green, ready to drink, ginseng, and honey, sweetened and Cranberry juice cocktail, bottled.
Infographic
Infographic link
Mineral Comparison
Mineral comparison score is based on the number of minerals by which one or the other food is richer. The "coverage" charts below show how much of the daily needs can be covered by 300 grams of the food.
| Contains more ManganeseManganese | +150% |
| Contains more PotassiumPotassium | +180% |
| Contains more IronIron | +400% |
| Contains more CopperCopper | +100% |
| Contains more ZincZinc | +200% |
| Contains more PhosphorusPhosphorus | +∞% |
| Contains more SeleniumSelenium | +∞% |
Vitamin Comparison
Vitamin comparison score is based on the number of vitamins by which one or the other food is richer. The "coverage" charts below show how much of the daily needs can be covered by 300 grams of the food.
| Contains more Vitamin B1Vitamin B1 | +∞% |
| Contains more Vitamin CVitamin C | +449.4% |
| Contains more Vitamin EVitamin E | +∞% |
| Contains more Vitamin B3Vitamin B3 | +∞% |
| Contains more Vitamin B5Vitamin B5 | +∞% |
| Contains more Vitamin KVitamin K | +∞% |
All nutrients comparison - raw data values
| Nutrient |  |
 |
DV% diff. |
| Vitamin C | 7.7mg | 42.3mg | 38% |
| Manganese | 0.12mg | 0.048mg | 3% |
| Vitamin B1 | 0.04mg | 0mg | 3% |
| Carbs | 7.16g | 13.52g | 2% |
| Fructose | 3.59g | 4.97g | 2% |
| Calories | 30kcal | 54kcal | 1% |
| Iron | 0.02mg | 0.1mg | 1% |
| Copper | 0.005mg | 0.01mg | 1% |
| Vitamin E | 0mg | 0.22mg | 1% |
| Vitamin B5 | 0mg | 0.052mg | 1% |
| Vitamin K | 0µg | 1µg | 1% |
| Caffeine | 4mg | 0mg | 1% |
| Weight per 100 calories | 333g | 185g | N/A |
| Fats | 0.18g | 0.1g | 0% |
| Net carbs | 7.16g | 13.52g | N/A |
| Magnesium | 1mg | 1mg | 0% |
| Calcium | 3mg | 3mg | 0% |
| Potassium | 5mg | 14mg | 0% |
| Sugar | 6.87g | 11.87g | N/A |
| Zinc | 0.01mg | 0.03mg | 0% |
| Phosphorus | 0mg | 1mg | 0% |
| Sodium | 2mg | 2mg | 0% |
| Selenium | 0µg | 0.2µg | 0% |
| Vitamin B3 | 0mg | 0.041mg | 0% |
| Choline | 0mg | 1.1mg | 0% |
| Saturated fat | 0g | 0.009g | 0% |
| Monounsaturated fat | 0g | 0.019g | 0% |
| Polyunsaturated fat | 0g | 0.059g | 0% |
Macronutrient Comparison
Macronutrient breakdown side-by-side comparison
Protein:
0 g
Fats:
0.18 g
Carbs:
7.16 g
Water:
92.65 g
Other:
0.01 g
Protein:
0 g
Fats:
0.1 g
Carbs:
13.52 g
Water:
86.17 g
Other:
0.21 g
| Contains more FatsFats | +80% |
| Contains more CarbsCarbs | +88.8% |
| Contains more OtherOther | +2000% |
~equal in
Protein
~0g
~equal in
Water
~86.17g
Carbohydrate type comparison
Carbohydrate type breakdown side-by-side comparison
Starch:
0 g
Sucrose:
0.49 g
Glucose:
2.79 g
Fructose:
3.59 g
Lactose:
0 g
Maltose:
0 g
Galactose:
0 g
Starch:
0 g
Sucrose:
0 g
Glucose:
6.79 g
Fructose:
4.97 g
Lactose:
0 g
Maltose:
0.12 g
Galactose:
0 g
| Contains more SucroseSucrose | +∞% |
| Contains more GlucoseGlucose | +143.4% |
| Contains more FructoseFructose | +38.4% |
| Contains more MaltoseMaltose | +∞% |
~equal in
Starch
~0g
~equal in
Lactose
~0g
~equal in
Galactose
~0g


