Significant differences between groat and jerky Groat has more copper, manganese, magnesium, vitamin B3, and fiber; however, jerky is richer in zinc, vitamin B12, and iron. Groat covers your daily copper needs 97% more than jerky. Jerky has 12 times less manganese than groat. Groat has 1.3mg of manganese, while jerky has 0.111mg. Groat contains less saturated fat. Groat has a higher glycemic index. The glycemic index of groat is 54, while the glycemic index of jerky is 0. Specific food types used in this comparison are Buckwheat and Snacks, beef jerky, chopped, and formed .
Infographic
Mineral Comparison
Mineral comparison score is based on the number of minerals by which one or the other food is richer. The "coverage" charts below show how much of the daily needs can be covered by 300 grams of the food.
4
100 g
300 g
1 cup - 170g
Magnesium
Magnesium
Calcium
Calcium
Potassium
Potassium
Iron
Iron
Copper
Copper
Zinc
Zinc
Phosphorus
Phosphorus
Sodium
Sodium
Manganese
Manganese
Selenium
Selenium
165%
5.4%
41%
83%
367%
65%
149%
0.13%
170%
45%
6
100 g
300 g
1 piece, large - 20g 1 oz - 28.35g 1 oz - 28.35g
Magnesium
Magnesium
Calcium
Calcium
Potassium
Potassium
Iron
Iron
Copper
Copper
Zinc
Zinc
Phosphorus
Phosphorus
Sodium
Sodium
Manganese
Manganese
Selenium
Selenium
36%
6%
53%
203%
76%
221%
174%
271%
14%
58%
Vitamin Comparison
Vitamin comparison score is based on the number of vitamins by which one or the other food is richer. The "coverage" charts below show how much of the daily needs can be covered by 300 grams of the food.
4
100 g
300 g
1 cup - 170g
Vitamin C
Vit. C
Vitamin D
Vit. D
Vitamin A
Vit. A
Vitamin E
Vit. E
Vitamin B1
Vit. B1
Vitamin B2
Vit. B2
Vitamin B3
Vit. B3
Vitamin B5
Vit. B5
Vitamin B6
Vit. B6
Vitamin B12
Vit. B12
Vitamin K
Vit. K
Folate
Folate
0%
0%
0%
0%
25%
98%
132%
74%
48%
0%
0%
23%
6
100 g
300 g
1 piece, large - 20g 1 oz - 28.35g 1 oz - 28.35g
Vitamin C
Vit. C
Vitamin D
Vit. D
Vitamin A
Vit. A
Vitamin E
Vit. E
Vitamin B1
Vit. B1
Vitamin B2
Vit. B2
Vitamin B3
Vit. B3
Vitamin B5
Vit. B5
Vitamin B6
Vit. B6
Vitamin B12
Vit. B12
Vitamin K
Vit. K
Folate
Folate
0%
4.5%
0%
9.8%
39%
33%
32%
9.8%
41%
124%
5.8%
101%
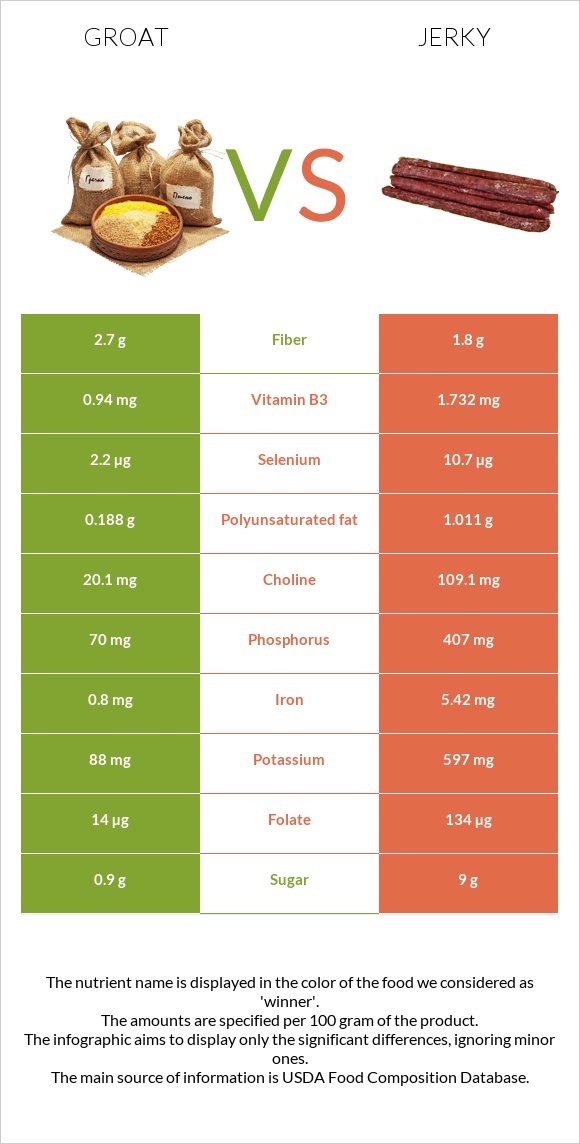
All nutrients comparison - raw data values
Nutrient
DV% diff.
Copper
1.1mg
0.227mg
97%
Sodium
1mg
2081mg
90%
Zinc
2.4mg
8.11mg
52%
Manganese
1.3mg
0.111mg
52%
Saturated fat
0.741g
10.85g
46%
Magnesium
231mg
51mg
43%
Vitamin B12
0µg
0.99µg
41%
Protein
13.25g
33.2g
40%
Iron
2.2mg
5.42mg
40%
Fats
3.4g
25.6g
34%
Fiber
10g
1.8g
33%
Vitamin B3
7.02mg
1.732mg
33%
Folate
30µg
134µg
26%
Monounsaturated fat
1.04g
11.305g
26%
Vitamin B2
0.425mg
0.142mg
22%
Vitamin B5
1.233mg
0.163mg
21%
Carbs
71.5g
11g
20%
Choline
109.1mg
20%
Cholesterol
0mg
48mg
16%
Phosphorus
347mg
407mg
9%
Potassium
460mg
597mg
4%
Selenium
8.3µg
10.7µg
4%
Vitamin B1
0.101mg
0.154mg
4%
Calories
343kcal
410kcal
3%
Vitamin E
0.49mg
3%
Vitamin D
0µg
0.3µg
2%
Vitamin B6
0.21mg
0.179mg
2%
Vitamin K
2.3µg
2%
Vitamin D*
0 IU
11 IU
1%
Protein per 100 calories
3.9g
8.1g
N/A
Calories per 10 g protein
259kcal
123kcal
N/A
Weight per 100 calories
29g
24g
N/A
Unsaturated / Saturated Fat ratio
2.8
1.1
N/A
Net carbs
61.5g
9.2g
N/A
Calcium
18mg
20mg
0%
Sugar
9g
N/A
Polyunsaturated fat
1.039g
1.011g
0%
Tryptophan
0.192mg
0%
Threonine
0.506mg
0%
Isoleucine
0.498mg
0%
Leucine
0.832mg
0%
Lysine
0.672mg
0%
Methionine
0.172mg
0%
Phenylalanine
0.52mg
0%
Valine
0.678mg
0%
Histidine
0.309mg
0%
Macronutrient Comparison
Macronutrient breakdown side-by-side comparison
1
13%
3%
72%
10%
2%
Protein:
13.25 g
Fats:
3.4 g
Carbs:
71.5 g
Water:
9.75 g
Other:
2.1 g
4
33%
26%
11%
23%
7%
Protein:
33.2 g
Fats:
25.6 g
Carbs:
11 g
Water:
23.36 g
Other:
6.84 g
Contains
more
Carbs Carbs
+550%
Contains
more
Protein Protein
+150.6%
Contains
more
Fats Fats
+652.9%
Contains
more
Water Water
+139.6%
Contains
more
Other Other
+225.7%
Fat Type Comparison
Fat type breakdown side-by-side comparison
2
26%
37%
37%
Saturated fat:
Sat. Fat
0.741 g
Monounsaturated fat:
Mono. Fat
1.04 g
Polyunsaturated fat:
Poly. Fat
1.039 g
1
47%
49%
4%
Saturated fat:
Sat. Fat
10.85 g
Monounsaturated fat:
Mono. Fat
11.305 g
Polyunsaturated fat:
Poly. Fat
1.011 g
Contains
less
Sat. Fat Saturated fat
-93.2%
Contains
more
Mono. Fat Monounsaturated fat
+987%
~equal in
Polyunsaturated fat
~1.011g