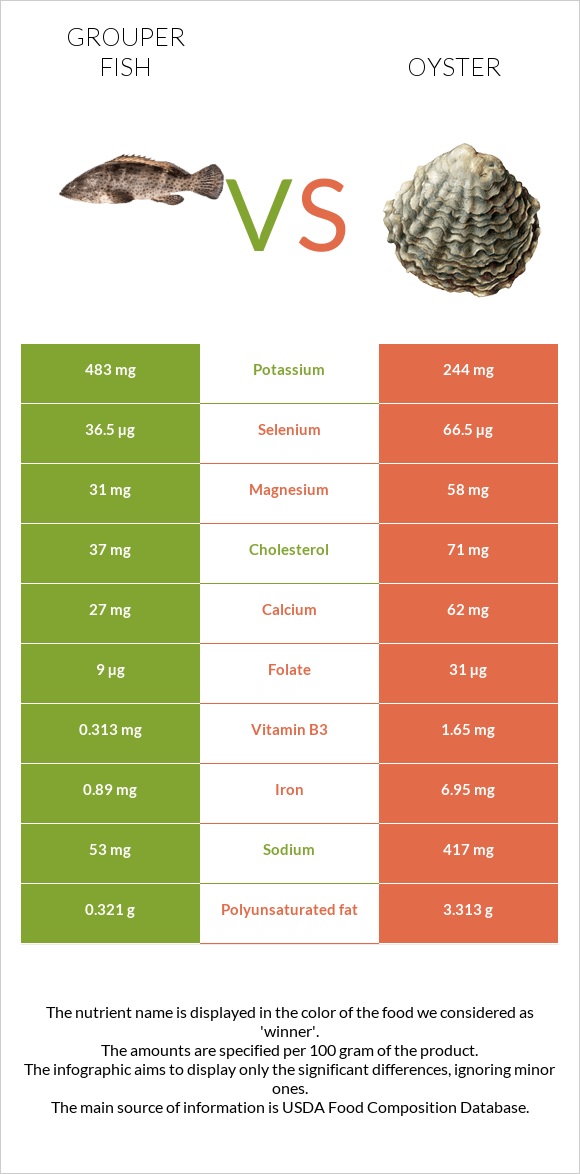
Differences between grouper and oysters Grouper has more vitamin B6, selenium, and potassium, while oysters has more zinc, vitamin B12, copper, iron, manganese, and vitamin B2. Oysters's daily need coverage for zinc is 710% higher. Oysters contains 6 times less vitamin B6 than grouper. Grouper contains 0.35mg of vitamin B6, while oysters contains 0.061mg. The amount of cholesterol in grouper is lower. The food types used in this comparison are Fish, grouper, mixed species, cooked, dry heat and Mollusks, oyster, eastern, wild, cooked, moist heat .
Infographic
Mineral Comparison
Mineral comparison score is based on the number of minerals by which one or the other food is richer. The "coverage" charts below show how much of the daily needs can be covered by 300 grams of the food.
3
100 g
300 g
3 oz - 85g 1 fillet - 202g
Magnesium
Magnesium
Calcium
Calcium
Potassium
Potassium
Iron
Iron
Copper
Copper
Zinc
Zinc
Phosphorus
Phosphorus
Sodium
Sodium
Manganese
Manganese
Selenium
Selenium
26%
6.3%
42%
43%
15%
14%
61%
6.9%
1.6%
255%
6
100 g
300 g
6 medium - 42g 3 oz - 85g
Magnesium
Magnesium
Calcium
Calcium
Potassium
Potassium
Iron
Iron
Copper
Copper
Zinc
Zinc
Phosphorus
Phosphorus
Sodium
Sodium
Manganese
Manganese
Selenium
Selenium
25%
35%
12%
345%
1902%
2144%
83%
22%
77%
215%
Vitamin Comparison
Vitamin comparison score is based on the number of vitamins by which one or the other food is richer. The "coverage" charts below show how much of the daily needs can be covered by 300 grams of the food.
4
100 g
300 g
3 oz - 85g 1 fillet - 202g
Vitamin C
Vit. C
Vitamin D
Vit. D
Vitamin A
Vit. A
Vitamin E
Vit. E
Vitamin B1
Vit. B1
Vitamin B2
Vit. B2
Vitamin B3
Vit. B3
Vitamin B5
Vit. B5
Vitamin B6
Vit. B6
Vitamin B12
Vit. B12
Vitamin K
Vit. K
Folate
Folate
0%
0%
17%
0%
20%
1.4%
7.1%
52%
81%
86%
0%
7.5%
6
100 g
300 g
6 medium - 42g 3 oz - 85g
Vitamin C
Vit. C
Vitamin D
Vit. D
Vitamin A
Vit. A
Vitamin E
Vit. E
Vitamin B1
Vit. B1
Vitamin B2
Vit. B2
Vitamin B3
Vit. B3
Vitamin B5
Vit. B5
Vitamin B6
Vit. B6
Vitamin B12
Vit. B12
Vitamin K
Vit. K
Folate
Folate
0%
0%
8.7%
34%
9%
42%
35%
27%
14%
2188%
5%
11%
All nutrients comparison - raw data values
Nutrient
DV% diff.
Zinc
0.51mg
78.6mg
710%
Vitamin B12
0.69µg
17.5µg
700%
Copper
0.045mg
5.707mg
629%
Iron
1.14mg
9.21mg
101%
Protein
24.84g
11.42g
27%
Manganese
0.012mg
0.591mg
25%
Choline
130mg
24%
Vitamin B6
0.35mg
0.061mg
22%
Selenium
46.8µg
39.5µg
13%
Vitamin B2
0.006mg
0.18mg
13%
Cholesterol
47mg
79mg
11%
Vitamin E
1.7mg
11%
Calcium
21mg
116mg
10%
Potassium
475mg
139mg
10%
Vitamin B3
0.381mg
1.85mg
9%
Vitamin B5
0.87mg
0.447mg
8%
Phosphorus
143mg
194mg
7%
Sodium
53mg
166mg
5%
Vitamin B1
0.081mg
0.036mg
4%
Polyunsaturated fat
0.403g
1.056g
4%
Fats
1.3g
3.42g
3%
Vitamin A
50µg
26µg
3%
Saturated fat
0.299g
0.948g
3%
Carbs
0g
5.45g
2%
Vitamin K
2µg
2%
Calories
118kcal
102kcal
1%
Folate
10µg
14µg
1%
Monounsaturated fat
0.268g
0.506g
1%
Protein per 100 calories
21g
11g
N/A
Calories per 10 g protein
48kcal
89kcal
N/A
Weight per 100 calories
85g
98g
N/A
Unsaturated / Saturated Fat ratio
2.2
1.6
N/A
Net carbs
0g
5.45g
N/A
Vitamin D*
2 IU
0%
Magnesium
37mg
35mg
0%
Sugar
1.23g
N/A
Starch
0.9g
0%
Trans fat
0.068g
N/A
Tryptophan
0.278mg
0.138mg
0%
Threonine
1.089mg
0.046mg
0%
Isoleucine
1.145mg
0.459mg
0%
Leucine
2.019mg
0.716mg
0%
Lysine
2.282mg
0.762mg
0%
Methionine
0.735mg
0.257mg
0%
Phenylalanine
0.97mg
0.413mg
0%
Valine
1.28mg
0.523mg
0%
Histidine
0.731mg
0.22mg
0%
Omega-3 - EPA
0.035g
0.353g
N/A
Omega-3 - DHA
0.213g
0.271g
N/A
Omega-3 - ALA
0.163g
N/A
Omega-3 - DPA
0.017g
0.02g
N/A
Omega-3 - Eicosatrienoic acid
0.004g
N/A
Omega-6 - Gamma-linoleic acid
0.004g
N/A
Omega-6 - Dihomo-gamma-linoleic acid
0.007g
N/A
Omega-6 - Eicosadienoic acid
0.007g
N/A
Omega-6 - Linoleic acid
0.061g
N/A
Macronutrient Comparison
Macronutrient breakdown side-by-side comparison
1
25%
73%
Protein:
24.84 g
Fats:
1.3 g
Carbs:
0 g
Water:
73.36 g
Other:
0.5 g
4
11%
3%
5%
78%
Protein:
11.42 g
Fats:
3.42 g
Carbs:
5.45 g
Water:
78.19 g
Other:
1.52 g
Contains
more
Protein Protein
+117.5%
Contains
more
Fats Fats
+163.1%
Contains
more
Carbs Carbs
+∞%
Contains
more
Other Other
+204%
Fat Type Comparison
Fat type breakdown side-by-side comparison
1
31%
28%
42%
Saturated fat:
Sat. Fat
0.299 g
Monounsaturated fat:
Mono. Fat
0.268 g
Polyunsaturated fat:
Poly. Fat
0.403 g
2
38%
20%
42%
Saturated fat:
Sat. Fat
0.948 g
Monounsaturated fat:
Mono. Fat
0.506 g
Polyunsaturated fat:
Poly. Fat
1.056 g
Contains
less
Sat. Fat Saturated fat
-68.5%
Contains
more
Mono. Fat Monounsaturated fat
+88.8%
Contains
more
Poly. Fat Polyunsaturated fat
+162%