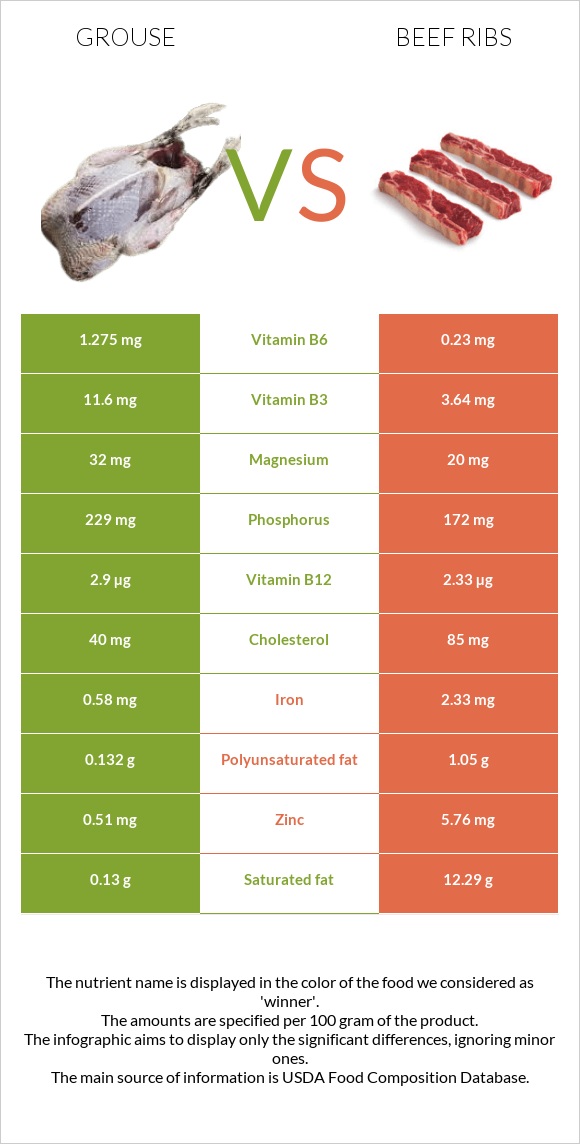
How are grouse and beef ribs different? Grouse is higher in vitamin B6, vitamin B3, vitamin B12, phosphorus, and vitamin B2; however, beef ribs are richer in zinc and iron. Daily need coverage for vitamin B6 for grouse is 80% higher. Grouse contains 3 times more vitamin B3 than beef ribs. While grouse contains 11.6mg of vitamin B3, beef ribs contain only 3.64mg. Grouse has less cholesterol. Ruffed Grouse, breast meat, skinless, raw and Beef, rib, large end (ribs 6-9), separable lean, and fat, trimmed to 0" fat, choice, cooked, roasted are the varieties used in this article.
Infographic
Mineral Comparison
Mineral comparison score is based on the number of minerals by which one or the other food is richer. The "coverage" charts below show how much of the daily needs can be covered by 300 grams of the food.
4
100 g
300 g
4 oz - 113g 1 breast - 219g 1 bird - 627g
Magnesium
Magnesium
Calcium
Calcium
Potassium
Potassium
Iron
Iron
Copper
Copper
Zinc
Zinc
Phosphorus
Phosphorus
Sodium
Sodium
Manganese
Manganese
Selenium
Selenium
23%
1.5%
27%
22%
19%
14%
98%
6.5%
2.1%
0%
5
100 g
300 g
3 oz - 85g 1 piece, cooked, excluding refuse (yield from 1 lb raw meat with refuse) - 290g
Magnesium
Magnesium
Calcium
Calcium
Potassium
Potassium
Iron
Iron
Copper
Copper
Zinc
Zinc
Phosphorus
Phosphorus
Sodium
Sodium
Manganese
Manganese
Selenium
Selenium
14%
3%
26%
87%
29%
157%
74%
8.3%
1.7%
116%
Vitamin Comparison
Vitamin comparison score is based on the number of vitamins by which one or the other food is richer. The "coverage" charts below show how much of the daily needs can be covered by 300 grams of the food.
6
100 g
300 g
4 oz - 113g 1 breast - 219g 1 bird - 627g
Vitamin C
Vit. C
Vitamin D
Vit. D
Vitamin A
Vit. A
Vitamin E
Vit. E
Vitamin B1
Vit. B1
Vitamin B2
Vit. B2
Vitamin B3
Vit. B3
Vitamin B5
Vit. B5
Vitamin B6
Vit. B6
Vitamin B12
Vit. B12
Vitamin K
Vit. K
Folate
Folate
0%
0%
1.7%
15%
11%
65%
218%
0%
294%
363%
0%
0%
3
100 g
300 g
3 oz - 85g 1 piece, cooked, excluding refuse (yield from 1 lb raw meat with refuse) - 290g
Vitamin C
Vit. C
Vitamin D
Vit. D
Vitamin A
Vit. A
Vitamin E
Vit. E
Vitamin B1
Vit. B1
Vitamin B2
Vit. B2
Vitamin B3
Vit. B3
Vitamin B5
Vit. B5
Vitamin B6
Vit. B6
Vitamin B12
Vit. B12
Vitamin K
Vit. K
Folate
Folate
0%
0%
0%
0%
18%
44%
68%
22%
53%
291%
0%
5.3%
All nutrients comparison - raw data values
Nutrient
DV% diff.
Vitamin B6
1.275mg
0.23mg
80%
Saturated fat
0.13g
12.29g
55%
Vitamin B3
11.6mg
3.64mg
50%
Zinc
0.51mg
5.76mg
48%
Fats
0.88g
30.49g
46%
Selenium
21.2µg
39%
Monounsaturated fat
0.042g
13.04g
32%
Vitamin B12
2.9µg
2.33µg
24%
Iron
0.58mg
2.33mg
22%
Cholesterol
40mg
85mg
15%
Calories
112kcal
372kcal
13%
Phosphorus
229mg
172mg
8%
Vitamin B2
0.28mg
0.19mg
7%
Vitamin B5
0.37mg
7%
Protein
25.94g
22.8g
6%
Polyunsaturated fat
0.132g
1.05g
6%
Vitamin E
0.73mg
5%
Magnesium
32mg
20mg
3%
Copper
0.058mg
0.088mg
3%
Vitamin B1
0.042mg
0.07mg
2%
Folate
7µg
2%
Calcium
5mg
10mg
1%
Potassium
311mg
290mg
1%
Sodium
50mg
64mg
1%
Vitamin A
5µg
0µg
1%
Protein per 100 calories
23g
6.1g
N/A
Calories per 10 g protein
43kcal
163kcal
N/A
Weight per 100 calories
89g
27g
N/A
Unsaturated / Saturated Fat ratio
1.3
1.1
N/A
Manganese
0.016mg
0.013mg
0%
Tryptophan
0.255mg
0%
Threonine
0.996mg
0%
Isoleucine
1.025mg
0%
Leucine
1.802mg
0%
Lysine
1.897mg
0%
Methionine
0.584mg
0%
Phenylalanine
0.89mg
0%
Valine
1.109mg
0%
Histidine
0.781mg
0%
Omega-3 - EPA
0.003g
N/A
Omega-3 - DHA
0.009g
N/A
Omega-3 - ALA
0.008g
N/A
Omega-3 - DPA
0.008g
N/A
Omega-6 - Dihomo-gamma-linoleic acid
0.001g
N/A
Omega-6 - Eicosadienoic acid
0.001g
N/A
Omega-6 - Linoleic acid
0.071g
N/A
Macronutrient Comparison
Macronutrient breakdown side-by-side comparison
2
26%
73%
Protein:
25.94 g
Fats:
0.88 g
Carbs:
0 g
Water:
72.93 g
Other:
0.25 g
2
23%
30%
46%
Protein:
22.8 g
Fats:
30.49 g
Carbs:
0 g
Water:
46.1 g
Other:
0.61 g
Contains
more
Protein Protein
+13.8%
Contains
more
Water Water
+58.2%
Contains
more
Fats Fats
+3364.8%
Contains
more
Other Other
+144%
Fat Type Comparison
Fat type breakdown side-by-side comparison
1
43%
14%
43%
Saturated fat:
Sat. Fat
0.13 g
Monounsaturated fat:
Mono. Fat
0.042 g
Polyunsaturated fat:
Poly. Fat
0.132 g
2
47%
49%
4%
Saturated fat:
Sat. Fat
12.29 g
Monounsaturated fat:
Mono. Fat
13.04 g
Polyunsaturated fat:
Poly. Fat
1.05 g
Contains
less
Sat. Fat Saturated fat
-98.9%
Contains
more
Mono. Fat Monounsaturated fat
+30947.6%
Contains
more
Poly. Fat Polyunsaturated fat
+695.5%