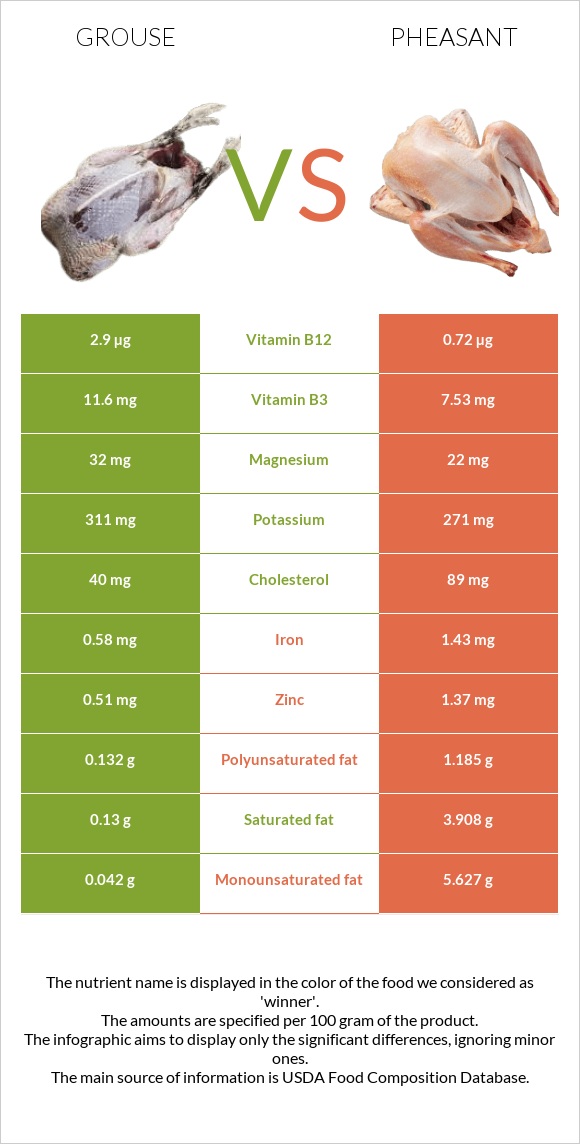
What are the main differences between grouse and pheasant? Grouse is richer in vitamin B12, vitamin B6, vitamin B3, and vitamin B2, yet pheasant is richer in iron and zinc. Grouse's daily need coverage for vitamin B12 is 91% higher. Grouse has 2 times more vitamin B6 than pheasant. Grouse has 1.275mg of vitamin B6, while pheasant has 0.75mg. Grouse contains less cholesterol. We used Ruffed Grouse, breast meat, skinless, raw and Pheasant, cooked, total edible types in this comparison.
Infographic
Mineral Comparison
Mineral comparison score is based on the number of minerals by which one or the other food is richer. The "coverage" charts below show how much of the daily needs can be covered by 300 grams of the food.
3
100 g
300 g
4 oz - 113g 1 breast - 219g 1 bird - 627g
Magnesium
Magnesium
Calcium
Calcium
Potassium
Potassium
Iron
Iron
Copper
Copper
Zinc
Zinc
Phosphorus
Phosphorus
Sodium
Sodium
Manganese
Manganese
Selenium
Selenium
23%
1.5%
27%
22%
19%
14%
98%
6.5%
2.1%
0%
6
100 g
300 g
1 cup, chopped or diced - 140g
Magnesium
Magnesium
Calcium
Calcium
Potassium
Potassium
Iron
Iron
Copper
Copper
Zinc
Zinc
Phosphorus
Phosphorus
Sodium
Sodium
Manganese
Manganese
Selenium
Selenium
16%
4.8%
24%
54%
28%
37%
104%
5.6%
0%
113%
Vitamin Comparison
Vitamin comparison score is based on the number of vitamins by which one or the other food is richer. The "coverage" charts below show how much of the daily needs can be covered by 300 grams of the food.
5
100 g
300 g
4 oz - 113g 1 breast - 219g 1 bird - 627g
Vitamin C
Vit. C
Vitamin D
Vit. D
Vitamin A
Vit. A
Vitamin E
Vit. E
Vitamin B1
Vit. B1
Vitamin B2
Vit. B2
Vitamin B3
Vit. B3
Vitamin B5
Vit. B5
Vitamin B6
Vit. B6
Vitamin B12
Vit. B12
Vitamin K
Vit. K
Folate
Folate
0%
0%
1.7%
15%
11%
65%
218%
0%
294%
363%
0%
0%
6
100 g
300 g
1 cup, chopped or diced - 140g
Vitamin C
Vit. C
Vitamin D
Vit. D
Vitamin A
Vit. A
Vitamin E
Vit. E
Vitamin B1
Vit. B1
Vitamin B2
Vit. B2
Vitamin B3
Vit. B3
Vitamin B5
Vit. B5
Vitamin B6
Vit. B6
Vitamin B12
Vit. B12
Vitamin K
Vit. K
Folate
Folate
7.7%
3%
19%
5.4%
18%
42%
141%
0%
173%
90%
12%
3.8%
All nutrients comparison - raw data values
Nutrient
DV% diff.
Vitamin B12
2.9µg
0.72µg
91%
Vitamin B6
1.275mg
0.75mg
40%
Selenium
20.7µg
38%
Vitamin B3
11.6mg
7.53mg
25%
Fats
0.88g
12.1g
17%
Saturated fat
0.13g
3.908g
17%
Cholesterol
40mg
89mg
16%
Choline
85.8mg
16%
Monounsaturated fat
0.042g
5.627g
14%
Protein
25.94g
32.4g
13%
Iron
0.58mg
1.43mg
11%
Zinc
0.51mg
1.37mg
8%
Vitamin B2
0.28mg
0.18mg
8%
Polyunsaturated fat
0.132g
1.185g
7%
Calories
112kcal
239kcal
6%
Vitamin A
5µg
57µg
6%
Vitamin K
4.9µg
4%
Vitamin C
0mg
2.3mg
3%
Copper
0.058mg
0.084mg
3%
Vitamin E
0.73mg
0.27mg
3%
Magnesium
32mg
22mg
2%
Phosphorus
229mg
242mg
2%
Vitamin B1
0.042mg
0.07mg
2%
Vitamin D*
7 IU
1%
Vitamin D
0.2µg
1%
Calcium
5mg
16mg
1%
Potassium
311mg
271mg
1%
Manganese
0.016mg
1%
Folate
5µg
1%
Protein per 100 calories
23g
14g
N/A
Calories per 10 g protein
43kcal
74kcal
N/A
Weight per 100 calories
89g
42g
N/A
Unsaturated / Saturated Fat ratio
1.3
1.7
N/A
Sodium
50mg
43mg
0%
Omega-3 - EPA
0.003g
0g
N/A
Omega-3 - DHA
0.009g
0g
N/A
Omega-3 - ALA
0.008g
N/A
Omega-3 - DPA
0.008g
0g
N/A
Omega-6 - Dihomo-gamma-linoleic acid
0.001g
N/A
Omega-6 - Eicosadienoic acid
0.001g
N/A
Omega-6 - Linoleic acid
0.071g
N/A
Macronutrient Comparison
Macronutrient breakdown side-by-side comparison
1
26%
73%
Protein:
25.94 g
Fats:
0.88 g
Carbs:
0 g
Water:
72.93 g
Other:
0.25 g
3
32%
12%
54%
Protein:
32.4 g
Fats:
12.1 g
Carbs:
0 g
Water:
54.2 g
Other:
1.3 g
Contains
more
Water Water
+34.6%
Contains
more
Protein Protein
+24.9%
Contains
more
Fats Fats
+1275%
Contains
more
Other Other
+420%
Fat Type Comparison
Fat type breakdown side-by-side comparison
1
43%
14%
43%
Saturated fat:
Sat. Fat
0.13 g
Monounsaturated fat:
Mono. Fat
0.042 g
Polyunsaturated fat:
Poly. Fat
0.132 g
2
36%
52%
11%
Saturated fat:
Sat. Fat
3.908 g
Monounsaturated fat:
Mono. Fat
5.627 g
Polyunsaturated fat:
Poly. Fat
1.185 g
Contains
less
Sat. Fat Saturated fat
-96.7%
Contains
more
Mono. Fat Monounsaturated fat
+13297.6%
Contains
more
Poly. Fat Polyunsaturated fat
+797.7%