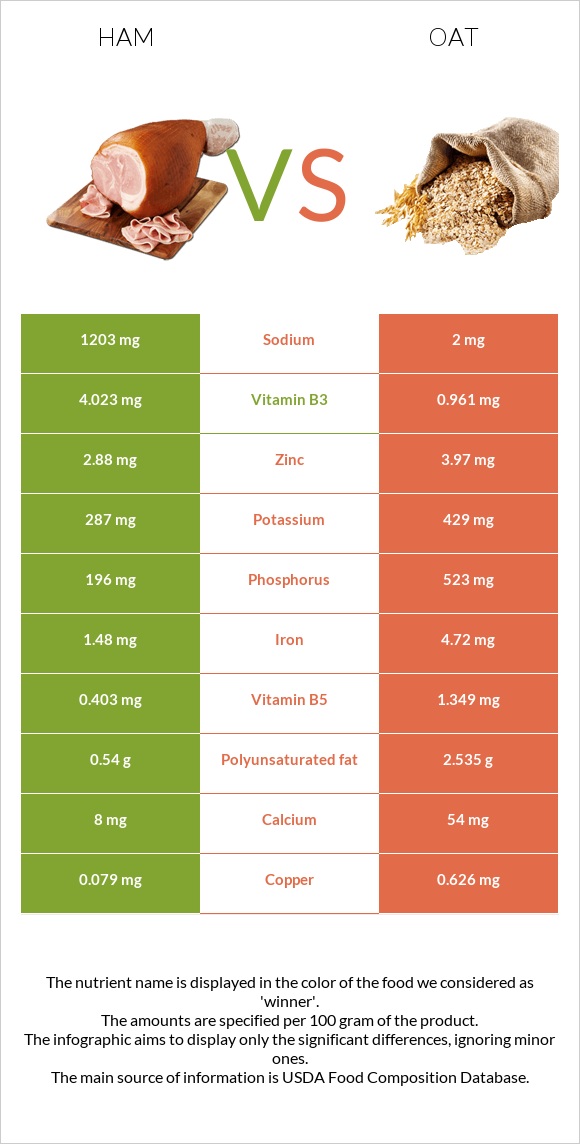
Important differences between ham and oats Ham has more vitamin B12, vitamin B6, and vitamin B3; however, oats have more manganese, copper, phosphorus, fiber, iron, and magnesium. Oats' daily need coverage for manganese is 211% more. Oats are lower in sodium. Oats have a higher glycemic index than ham. The food varieties used in the comparison are Pork, cured, ham, boneless, extra lean (approximately 5% fat), roasted and Oats .
Infographic
Mineral Comparison
Mineral comparison score is based on the number of minerals by which one or the other food is richer. The "coverage" charts below show how much of the daily needs can be covered by 300 grams of the food.
1
100 g
300 g
3 oz - 85g 1 cup - 140g
Magnesium
Magnesium
Calcium
Calcium
Potassium
Potassium
Iron
Iron
Copper
Copper
Zinc
Zinc
Phosphorus
Phosphorus
Sodium
Sodium
Manganese
Manganese
Selenium
Selenium
10%
2.4%
25%
56%
26%
79%
84%
157%
7%
106%
9
100 g
300 g
1 cup - 156g
Magnesium
Magnesium
Calcium
Calcium
Potassium
Potassium
Iron
Iron
Copper
Copper
Zinc
Zinc
Phosphorus
Phosphorus
Sodium
Sodium
Manganese
Manganese
Selenium
Selenium
126%
16%
38%
177%
209%
108%
224%
0.26%
641%
0%
Vitamin Comparison
Vitamin comparison score is based on the number of vitamins by which one or the other food is richer. The "coverage" charts below show how much of the daily needs can be covered by 300 grams of the food.
6
100 g
300 g
3 oz - 85g 1 cup - 140g
Vitamin C
Vit. C
Vitamin D
Vit. D
Vitamin A
Vit. A
Vitamin E
Vit. E
Vitamin B1
Vit. B1
Vitamin B2
Vit. B2
Vitamin B3
Vit. B3
Vitamin B5
Vit. B5
Vitamin B6
Vit. B6
Vitamin B12
Vit. B12
Vitamin K
Vit. K
Folate
Folate
0%
12%
0%
5%
189%
47%
75%
24%
92%
81%
0%
2.3%
2
100 g
300 g
1 cup - 156g
Vitamin C
Vit. C
Vitamin D
Vit. D
Vitamin A
Vit. A
Vitamin E
Vit. E
Vitamin B1
Vit. B1
Vitamin B2
Vit. B2
Vitamin B3
Vit. B3
Vitamin B5
Vit. B5
Vitamin B6
Vit. B6
Vitamin B12
Vit. B12
Vitamin K
Vit. K
Folate
Folate
0%
0%
0%
0%
191%
32%
18%
81%
27%
0%
0%
42%
All nutrients comparison - raw data values
Nutrient
DV% diff.
Manganese
0.054mg
4.916mg
211%
Copper
0.079mg
0.626mg
61%
Sodium
1203mg
2mg
52%
Phosphorus
196mg
523mg
47%
Fiber
0g
10.6g
42%
Iron
1.48mg
4.72mg
41%
Magnesium
14mg
177mg
39%
Selenium
19.5µg
35%
Vitamin B12
0.65µg
0µg
27%
Carbs
1.5g
66.27g
22%
Vitamin B6
0.4mg
0.119mg
22%
Vitamin B3
4.023mg
0.961mg
19%
Vitamin B5
0.403mg
1.349mg
19%
Cholesterol
53mg
0mg
18%
Choline
85.1mg
15%
Folate
3µg
56µg
13%
Polyunsaturated fat
0.54g
2.535g
13%
Calories
145kcal
389kcal
12%
Zinc
2.88mg
3.97mg
10%
Protein
20.93g
16.89g
8%
Calcium
8mg
54mg
5%
Vitamin B2
0.202mg
0.139mg
5%
Vitamin D*
32 IU
0 IU
4%
Vitamin D
0.8µg
0µg
4%
Potassium
287mg
429mg
4%
Saturated fat
1.81g
1.217g
3%
Fats
5.53g
6.9g
2%
Vitamin E
0.25mg
2%
Vitamin B1
0.754mg
0.763mg
1%
Monounsaturated fat
2.62g
2.178g
1%
Protein per 100 calories
14g
4.3g
N/A
Calories per 10 g protein
69kcal
230kcal
N/A
Weight per 100 calories
69g
26g
N/A
Unsaturated / Saturated Fat ratio
1.7
3.9
N/A
Net carbs
1.5g
55.67g
N/A
Tryptophan
0.251mg
0.234mg
0%
Threonine
0.931mg
0.575mg
0%
Isoleucine
0.918mg
0.694mg
0%
Leucine
1.661mg
1.284mg
0%
Lysine
1.775mg
0.701mg
0%
Methionine
0.553mg
0.312mg
0%
Phenylalanine
0.904mg
0.895mg
0%
Valine
0.908mg
0.937mg
0%
Histidine
0.75mg
0.405mg
0%
Macronutrient Comparison
Macronutrient breakdown side-by-side comparison
3
21%
6%
68%
4%
Protein:
20.93 g
Fats:
5.53 g
Carbs:
1.5 g
Water:
67.67 g
Other:
4.37 g
2
17%
7%
66%
8%
2%
Protein:
16.89 g
Fats:
6.9 g
Carbs:
66.27 g
Water:
8.22 g
Other:
1.72 g
Contains
more
Protein Protein
+23.9%
Contains
more
Water Water
+723.2%
Contains
more
Other Other
+154.1%
Contains
more
Fats Fats
+24.8%
Contains
more
Carbs Carbs
+4318%
Fat Type Comparison
Fat type breakdown side-by-side comparison
1
36%
53%
11%
Saturated fat:
Sat. Fat
1.81 g
Monounsaturated fat:
Mono. Fat
2.62 g
Polyunsaturated fat:
Poly. Fat
0.54 g
2
21%
37%
43%
Saturated fat:
Sat. Fat
1.217 g
Monounsaturated fat:
Mono. Fat
2.178 g
Polyunsaturated fat:
Poly. Fat
2.535 g
Contains
more
Mono. Fat Monounsaturated fat
+20.3%
Contains
less
Sat. Fat Saturated fat
-32.8%
Contains
more
Poly. Fat Polyunsaturated fat
+369.4%