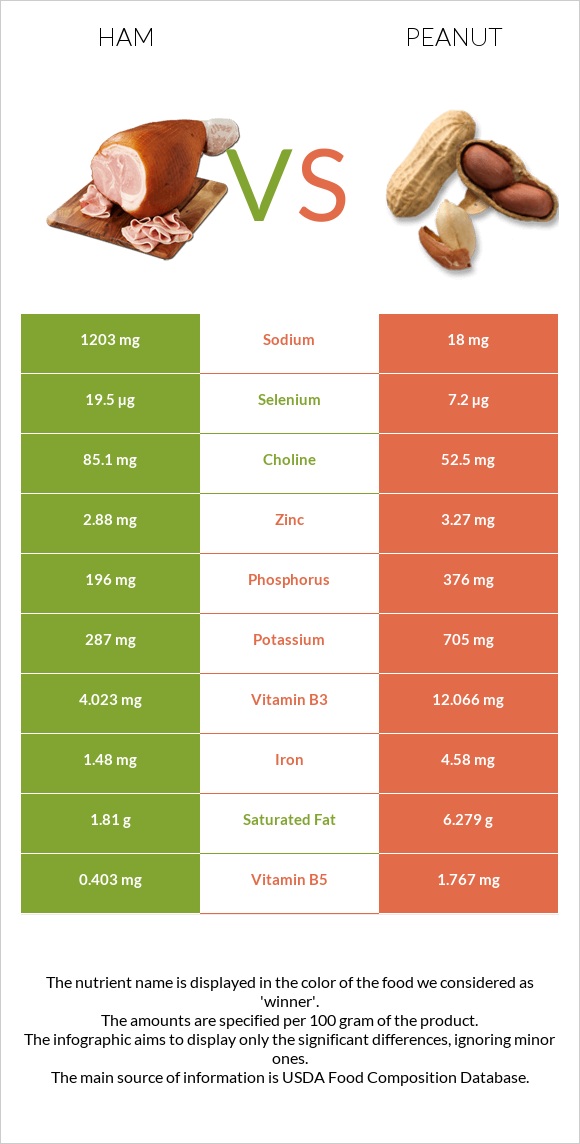
Differences between ham and peanuts Ham contains less copper, manganese, folate, vitamin E, vitamin B3, iron, magnesium, fiber, and vitamin B5 than peanuts. Peanuts' daily need coverage for copper is 118% higher. Peanuts contain 67 times less sodium than ham. Ham contains 1203mg of sodium, while peanuts contain 18mg. Ham has a lower glycemic index. The glycemic index of ham is 0, while the glycemic index of peanuts is 13. The food types used in this comparison are Pork, cured, ham, boneless, extra lean (approximately 5% fat), roasted and Peanuts, all types, raw .
Infographic
Mineral Comparison
Mineral comparison score is based on the number of minerals by which one or the other food is richer. The "coverage" charts below show how much of the daily needs can be covered by 300 grams of the food.
1
100 g
300 g
3 oz - 85g 1 cup - 140g
Magnesium
Magnesium
Calcium
Calcium
Potassium
Potassium
Iron
Iron
Copper
Copper
Zinc
Zinc
Phosphorus
Phosphorus
Sodium
Sodium
Manganese
Manganese
Selenium
Selenium
10%
2.4%
25%
56%
26%
79%
84%
157%
7%
106%
9
100 g
300 g
1 oz - 28.35g 1 cup - 146g
Magnesium
Magnesium
Calcium
Calcium
Potassium
Potassium
Iron
Iron
Copper
Copper
Zinc
Zinc
Phosphorus
Phosphorus
Sodium
Sodium
Manganese
Manganese
Selenium
Selenium
120%
28%
62%
172%
381%
89%
161%
2.3%
252%
39%
Vitamin Comparison
Vitamin comparison score is based on the number of vitamins by which one or the other food is richer. The "coverage" charts below show how much of the daily needs can be covered by 300 grams of the food.
5
100 g
300 g
3 oz - 85g 1 cup - 140g
Vitamin C
Vit. C
Vitamin D
Vit. D
Vitamin A
Vit. A
Vitamin E
Vit. E
Vitamin B1
Vit. B1
Vitamin B2
Vit. B2
Vitamin B3
Vit. B3
Vitamin B5
Vit. B5
Vitamin B6
Vit. B6
Vitamin B12
Vit. B12
Vitamin K
Vit. K
Folate
Folate
0%
12%
0%
5%
189%
47%
75%
24%
92%
81%
0%
2.3%
4
100 g
300 g
1 oz - 28.35g 1 cup - 146g
Vitamin C
Vit. C
Vitamin D
Vit. D
Vitamin A
Vit. A
Vitamin E
Vit. E
Vitamin B1
Vit. B1
Vitamin B2
Vit. B2
Vitamin B3
Vit. B3
Vitamin B5
Vit. B5
Vitamin B6
Vit. B6
Vitamin B12
Vit. B12
Vitamin K
Vit. K
Folate
Folate
0%
0%
0%
167%
160%
31%
226%
106%
80%
0%
0%
180%
All nutrients comparison - raw data values
Nutrient
DV% diff.
Copper
0.079mg
1.144mg
118%
Polyunsaturated fat
0.54g
15.558g
100%
Manganese
0.054mg
1.934mg
82%
Fats
5.53g
49.24g
67%
Folate
3µg
240µg
59%
Monounsaturated fat
2.62g
24.426g
55%
Vitamin E
0.25mg
8.33mg
54%
Sodium
1203mg
18mg
52%
Vitamin B3
4.023mg
12.066mg
50%
Iron
1.48mg
4.58mg
39%
Magnesium
14mg
168mg
37%
Fiber
0g
8.5g
34%
Vitamin B5
0.403mg
1.767mg
27%
Vitamin B12
0.65µg
0µg
27%
Phosphorus
196mg
376mg
26%
Selenium
19.5µg
7.2µg
22%
Calories
145kcal
567kcal
21%
Saturated fat
1.81g
6.279g
20%
Cholesterol
53mg
0mg
18%
Potassium
287mg
705mg
12%
Protein
20.93g
25.8g
10%
Vitamin B1
0.754mg
0.64mg
10%
Calcium
8mg
92mg
8%
Choline
85.1mg
52.5mg
6%
Carbs
1.5g
16.13g
5%
Vitamin B2
0.202mg
0.135mg
5%
Vitamin D*
32 IU
0 IU
4%
Vitamin D
0.8µg
0µg
4%
Zinc
2.88mg
3.27mg
4%
Vitamin B6
0.4mg
0.348mg
4%
Protein per 100 calories
14g
4.6g
N/A
Calories per 10 g protein
69kcal
220kcal
N/A
Weight per 100 calories
69g
18g
N/A
Unsaturated / Saturated Fat ratio
1.7
6.4
N/A
Net carbs
1.5g
7.63g
N/A
Sugar
0g
4.72g
N/A
Tryptophan
0.251mg
0.25mg
0%
Threonine
0.931mg
0.883mg
0%
Isoleucine
0.918mg
0.907mg
0%
Leucine
1.661mg
1.672mg
0%
Lysine
1.775mg
0.926mg
0%
Methionine
0.553mg
0.317mg
0%
Phenylalanine
0.904mg
1.377mg
0%
Valine
0.908mg
1.082mg
0%
Histidine
0.75mg
0.652mg
0%
Macronutrient Comparison
Macronutrient breakdown side-by-side comparison
2
21%
6%
68%
4%
Protein:
20.93 g
Fats:
5.53 g
Carbs:
1.5 g
Water:
67.67 g
Other:
4.37 g
3
26%
49%
16%
7%
2%
Protein:
25.8 g
Fats:
49.24 g
Carbs:
16.13 g
Water:
6.5 g
Other:
2.33 g
Contains
more
Water Water
+941.1%
Contains
more
Other Other
+87.6%
Contains
more
Protein Protein
+23.3%
Contains
more
Fats Fats
+790.4%
Contains
more
Carbs Carbs
+975.3%
Fat Type Comparison
Fat type breakdown side-by-side comparison
1
36%
53%
11%
Saturated fat:
Sat. Fat
1.81 g
Monounsaturated fat:
Mono. Fat
2.62 g
Polyunsaturated fat:
Poly. Fat
0.54 g
2
14%
53%
34%
Saturated fat:
Sat. Fat
6.279 g
Monounsaturated fat:
Mono. Fat
24.426 g
Polyunsaturated fat:
Poly. Fat
15.558 g
Contains
less
Sat. Fat Saturated fat
-71.2%
Contains
more
Mono. Fat Monounsaturated fat
+832.3%
Contains
more
Poly. Fat Polyunsaturated fat
+2781.1%