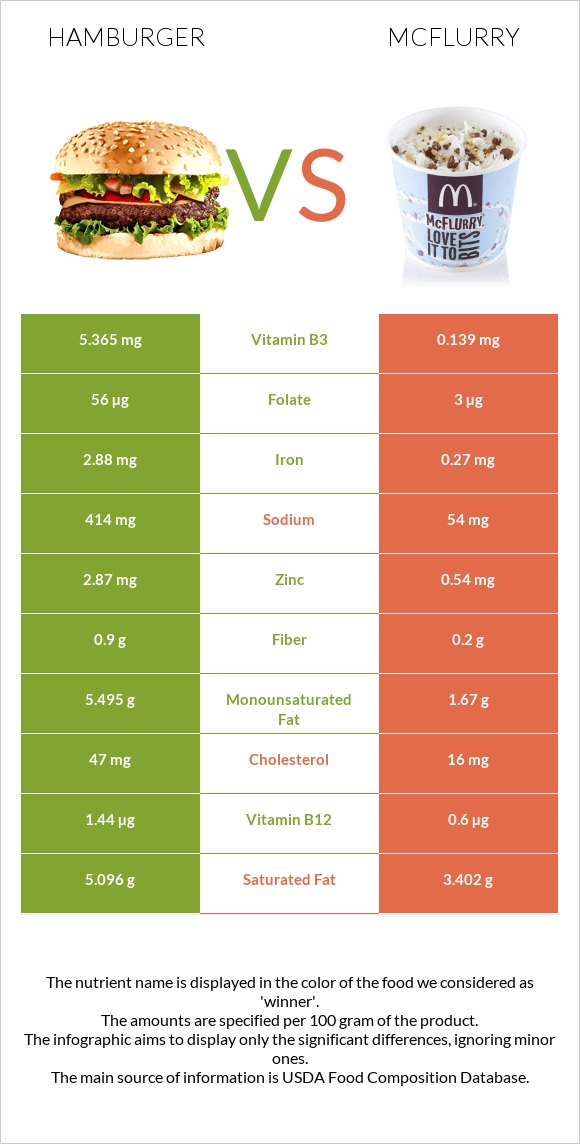
How are hamburgers and mcFlurry different? Hamburgers are higher than mcFlurry in vitamin B12, vitamin B3, iron, zinc, vitamin B1, folate, and vitamin B6. Hamburgers cover your daily need for vitamin B12, 35% more than mcFlurry. Hamburgers contain 39 times more vitamin B3 than mcFlurry. Hamburgers contain 5.365mg of vitamin B3, while mcFlurry contains 0.139mg. McFlurry is lower in sodium. Fast foods, hamburger; double, regular, patty; plain and McDONALD'S, McFLURRY with M&M'S CANDIES types were used in this article.
Infographic
Mineral Comparison
Mineral comparison score is based on the number of minerals by which one or the other food is richer. The "coverage" charts below show how much of the daily needs can be covered by 300 grams of the food.
6
100 g
300 g
1 item - 120g
Magnesium
Magnesium
Calcium
Calcium
Potassium
Potassium
Iron
Iron
Copper
Copper
Zinc
Zinc
Phosphorus
Phosphorus
Sodium
Sodium
Manganese
Manganese
Selenium
Selenium
14%
31%
20%
108%
30%
78%
58%
54%
28%
0%
2
100 g
300 g
1 regular (12 fl oz) - 348g 1 large (16 fl oz) - 504g
Magnesium
Magnesium
Calcium
Calcium
Potassium
Potassium
Iron
Iron
Copper
Copper
Zinc
Zinc
Phosphorus
Phosphorus
Sodium
Sodium
Manganese
Manganese
Selenium
Selenium
12%
41%
18%
10%
15%
15%
50%
7%
6%
0%
Vitamin Comparison
Vitamin comparison score is based on the number of vitamins by which one or the other food is richer. The "coverage" charts below show how much of the daily needs can be covered by 300 grams of the food.
5
100 g
300 g
1 item - 120g
Vitamin C
Vit. C
Vitamin D
Vit. D
Vitamin A
Vit. A
Vitamin E
Vit. E
Vitamin B1
Vit. B1
Vitamin B2
Vit. B2
Vitamin B3
Vit. B3
Vitamin B5
Vit. B5
Vitamin B6
Vit. B6
Vitamin B12
Vit. B12
Vitamin K
Vit. K
Folate
Folate
0%
0%
0%
0%
54%
58%
101%
19%
47%
180%
0%
42%
2
100 g
300 g
1 regular (12 fl oz) - 348g 1 large (16 fl oz) - 504g
Vitamin C
Vit. C
Vitamin D
Vit. D
Vitamin A
Vit. A
Vitamin E
Vit. E
Vitamin B1
Vit. B1
Vitamin B2
Vit. B2
Vitamin B3
Vit. B3
Vitamin B5
Vit. B5
Vitamin B6
Vit. B6
Vitamin B12
Vit. B12
Vitamin K
Vit. K
Folate
Folate
0%
0%
0%
1.6%
13%
56%
2.6%
44%
12%
75%
0%
2.3%
All nutrients comparison - raw data values
Nutrient
DV% diff.
Vitamin B12
1.44µg
0.6µg
35%
Iron
2.88mg
0.27mg
33%
Vitamin B3
5.365mg
0.139mg
33%
Protein
17.08g
4.02g
26%
Zinc
2.87mg
0.54mg
21%
Sodium
414mg
54mg
16%
Vitamin B1
0.217mg
0.051mg
14%
Folate
56µg
3µg
13%
Fats
14.36g
6.46g
12%
Vitamin B6
0.203mg
0.053mg
12%
Cholesterol
47mg
16mg
10%
Monounsaturated fat
5.495g
1.67g
10%
Vitamin B5
0.31mg
0.73mg
8%
Saturated fat
5.096g
3.402g
8%
Manganese
0.217mg
0.046mg
7%
Calories
295kcal
177kcal
6%
Copper
0.091mg
0.044mg
5%
Calcium
102mg
135mg
3%
Fiber
0.9g
0.2g
3%
Phosphorus
136mg
116mg
3%
Fructose
2.03g
0.21g
2%
Carbs
24.1g
26.82g
1%
Magnesium
20mg
17mg
1%
Potassium
226mg
208mg
1%
Vitamin E
0.08mg
1%
Vitamin B2
0.25mg
0.243mg
1%
Polyunsaturated fat
0.38g
0.282g
1%
Protein per 100 calories
5.8g
2.3g
N/A
Calories per 10 g protein
173kcal
440kcal
N/A
Weight per 100 calories
34g
56g
N/A
Unsaturated / Saturated Fat ratio
1.2
0.57
N/A
Net carbs
23.2g
26.62g
N/A
Sugar
4.15g
24.37g
N/A
Trans fat
0.814g
0.281g
N/A
Tryptophan
0.206mg
0%
Threonine
0.666mg
0%
Isoleucine
0.716mg
0%
Leucine
1.319mg
0%
Lysine
1.226mg
0%
Methionine
0.37mg
0%
Phenylalanine
0.677mg
0%
Valine
0.823mg
0%
Histidine
0.505mg
0%
Macronutrient Comparison
Macronutrient breakdown side-by-side comparison
3
17%
14%
24%
43%
2%
Protein:
17.08 g
Fats:
14.36 g
Carbs:
24.1 g
Water:
42.67 g
Other:
1.79 g
2
4%
6%
27%
62%
Protein:
4.02 g
Fats:
6.46 g
Carbs:
26.82 g
Water:
61.74 g
Other:
0.96 g
Contains
more
Protein Protein
+324.9%
Contains
more
Fats Fats
+122.3%
Contains
more
Other Other
+86.5%
Contains
more
Carbs Carbs
+11.3%
Contains
more
Water Water
+44.7%
Fat Type Comparison
Fat type breakdown side-by-side comparison
2
46%
50%
3%
Saturated fat:
Sat. Fat
5.096 g
Monounsaturated fat:
Mono. Fat
5.495 g
Polyunsaturated fat:
Poly. Fat
0.38 g
1
64%
31%
5%
Saturated fat:
Sat. Fat
3.402 g
Monounsaturated fat:
Mono. Fat
1.67 g
Polyunsaturated fat:
Poly. Fat
0.282 g
Contains
more
Mono. Fat Monounsaturated fat
+229%
Contains
more
Poly. Fat Polyunsaturated fat
+34.8%
Contains
less
Sat. Fat Saturated fat
-33.2%
Carbohydrate type comparison
Carbohydrate type breakdown side-by-side comparison
3
5%
28%
49%
3%
14%
Starch:
0 g
Sucrose:
0.22 g
Glucose:
1.16 g
Fructose:
2.03 g
Lactose:
0.13 g
Maltose:
0.6 g
Galactose:
0 g
2
69%
3%
26%
Starch:
0 g
Sucrose:
16.9 g
Glucose:
0.75 g
Fructose:
0.21 g
Lactose:
6.23 g
Maltose:
0.28 g
Galactose:
0 g
Contains
more
Glucose Glucose
+54.7%
Contains
more
Fructose Fructose
+866.7%
Contains
more
Maltose Maltose
+114.3%
Contains
more
Sucrose Sucrose
+7581.8%
Contains
more
Lactose Lactose
+4692.3%
~equal in
Starch
~0g
~equal in
Galactose
~0g