Differences between ice cream and quince Ice cream has more vitamin B12, vitamin B2, phosphorus, calcium, and vitamin B5, while quince has more vitamin C, copper, and iron. Ice cream's daily need coverage for saturated fat is 34% higher. The amount of cholesterol in quince is lower. Quince has a lower glycemic index. The glycemic index of quince is 35, while the glycemic index of ice cream is 62. The food types used in this comparison are Ice creams, vanilla and Quinces, raw .
Infographic
Mineral Comparison
Mineral comparison score is based on the number of minerals by which one or the other food is richer. The "coverage" charts below show how much of the daily needs can be covered by 300 grams of the food.
6
100 g
300 g
1 serving 1/2 cup - 66g
Magnesium
Magnesium
Calcium
Calcium
Potassium
Potassium
Iron
Iron
Copper
Copper
Zinc
Zinc
Phosphorus
Phosphorus
Sodium
Sodium
Manganese
Manganese
Selenium
Selenium
10%
38%
18%
3.4%
7.7%
19%
45%
10%
1%
9.8%
3
100 g
300 g
1 fruit without refuse - 92g
Magnesium
Magnesium
Calcium
Calcium
Potassium
Potassium
Iron
Iron
Copper
Copper
Zinc
Zinc
Phosphorus
Phosphorus
Sodium
Sodium
Manganese
Manganese
Selenium
Selenium
5.7%
3.3%
17%
26%
43%
1.1%
7.3%
0.52%
0%
3.3%
Vitamin Comparison
Vitamin comparison score is based on the number of vitamins by which one or the other food is richer. The "coverage" charts below show how much of the daily needs can be covered by 300 grams of the food.
10
100 g
300 g
1 serving 1/2 cup - 66g
Vitamin C
Vit. C
Vitamin D
Vit. D
Vitamin A
Vit. A
Vitamin E
Vit. E
Vitamin B1
Vit. B1
Vitamin B2
Vit. B2
Vitamin B3
Vit. B3
Vitamin B5
Vit. B5
Vitamin B6
Vit. B6
Vitamin B12
Vit. B12
Vitamin K
Vit. K
Folate
Folate
2%
3%
39%
6%
10%
55%
2.2%
35%
11%
49%
0.75%
3.8%
2
100 g
300 g
1 fruit without refuse - 92g
Vitamin C
Vit. C
Vitamin D
Vit. D
Vitamin A
Vit. A
Vitamin E
Vit. E
Vitamin B1
Vit. B1
Vitamin B2
Vit. B2
Vitamin B3
Vit. B3
Vitamin B5
Vit. B5
Vitamin B6
Vit. B6
Vitamin B12
Vit. B12
Vitamin K
Vit. K
Folate
Folate
50%
0%
0.67%
0%
5%
6.9%
3.8%
4.9%
9.2%
0%
0%
2.3%
All nutrients comparison - raw data values
Nutrient
DV% diff.
Saturated fat
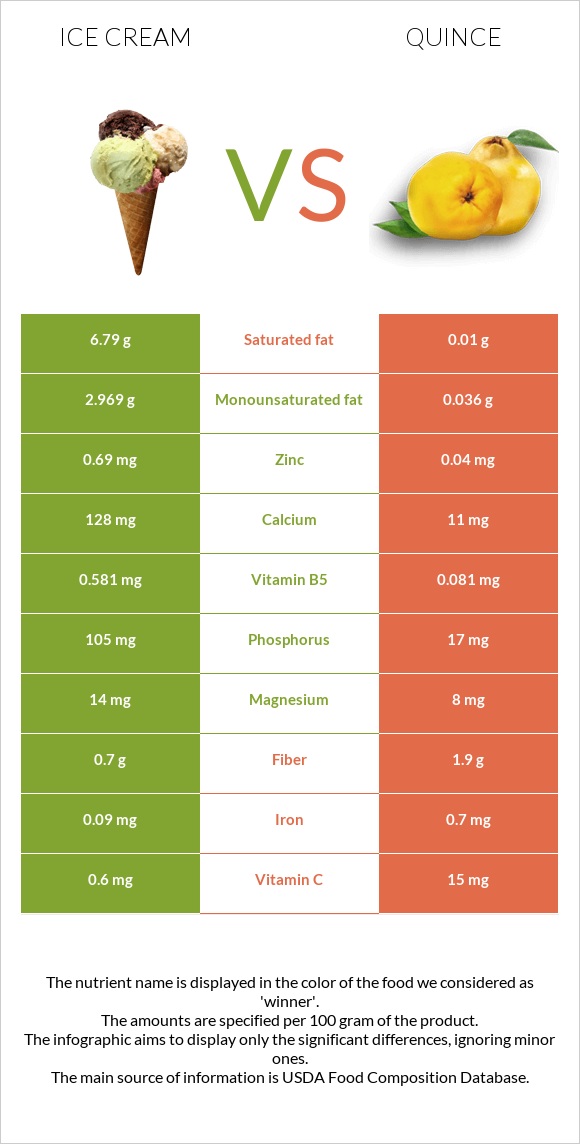
6.79g
0.01g
31%
Fats
11g
0.1g
17%
Vitamin C
0.6mg
15mg
16%
Vitamin B2
0.24mg
0.03mg
16%
Vitamin B12
0.39µg
0µg
16%
Cholesterol
44mg
0mg
15%
Phosphorus
105mg
17mg
13%
Vitamin A
118µg
2µg
13%
Calcium
128mg
11mg
12%
Copper
0.023mg
0.13mg
12%
Vitamin B5
0.581mg
0.081mg
10%
Calories
207kcal
57kcal
8%
Iron
0.09mg
0.7mg
8%
Monounsaturated fat
2.969g
0.036g
7%
Protein
3.5g
0.4g
6%
Zinc
0.69mg
0.04mg
6%
Fiber
0.7g
1.9g
5%
Choline
26mg
5%
Carbs
23.6g
15.3g
3%
Sodium
80mg
4mg
3%
Polyunsaturated fat
0.452g
0.05g
3%
Vitamin E
0.3mg
2%
Selenium
1.8µg
0.6µg
2%
Vitamin B1
0.041mg
0.02mg
2%
Vitamin D*
8 IU
1%
Vitamin D
0.2µg
1%
Magnesium
14mg
8mg
1%
Vitamin B3
0.116mg
0.2mg
1%
Vitamin B6
0.048mg
0.04mg
1%
Folate
5µg
3µg
1%
Protein per 100 calories
1.7g
0.7g
N/A
Calories per 10 g protein
591kcal
1425kcal
N/A
Weight per 100 calories
48g
175g
N/A
Unsaturated / Saturated Fat ratio
0.5
8.6
N/A
Net carbs
22.9g
13.4g
N/A
Potassium
199mg
197mg
0%
Sugar
21.22g
N/A
Manganese
0.008mg
0%
Vitamin K
0.3µg
0%
Tryptophan
0.045mg
0%
Threonine
0.146mg
0%
Isoleucine
0.195mg
0%
Leucine
0.316mg
0%
Lysine
0.258mg
0%
Methionine
0.081mg
0%
Phenylalanine
0.157mg
0%
Valine
0.217mg
0%
Histidine
0.088mg
0%
Omega-3 - EPA
0.003g
0g
N/A
Macronutrient Comparison
Macronutrient breakdown side-by-side comparison
4
4%
11%
24%
61%
Protein:
3.5 g
Fats:
11 g
Carbs:
23.6 g
Water:
61 g
Other:
0.9 g
1
15%
84%
Protein:
0.4 g
Fats:
0.1 g
Carbs:
15.3 g
Water:
83.8 g
Other:
0.4 g
Contains
more
Protein Protein
+775%
Contains
more
Fats Fats
+10900%
Contains
more
Carbs Carbs
+54.2%
Contains
more
Other Other
+125%
Contains
more
Water Water
+37.4%
Fat Type Comparison
Fat type breakdown side-by-side comparison
2
66%
29%
4%
Saturated fat:
Sat. Fat
6.79 g
Monounsaturated fat:
Mono. Fat
2.969 g
Polyunsaturated fat:
Poly. Fat
0.452 g
1
10%
38%
52%
Saturated fat:
Sat. Fat
0.01 g
Monounsaturated fat:
Mono. Fat
0.036 g
Polyunsaturated fat:
Poly. Fat
0.05 g
Contains
more
Mono. Fat Monounsaturated fat
+8147.2%
Contains
more
Poly. Fat Polyunsaturated fat
+804%
Contains
less
Sat. Fat Saturated fat
-99.9%