Jelly bean vs. Pico de gallo — In-Depth Nutrition Comparison
Compare
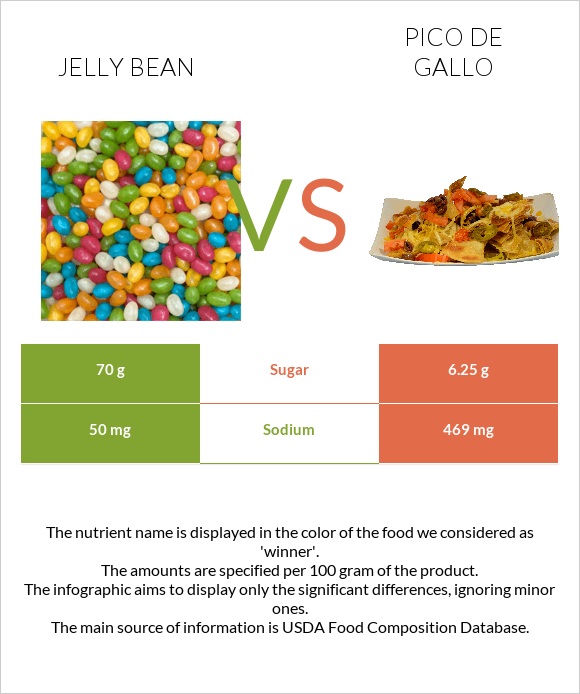
A recap on the differences between jelly bean and pico de gallo
- Pico de gallo is higher than jelly bean in vitamin A.
- Pico de gallo covers your daily sodium needs 18% more than jelly bean.
- Jelly bean contains 11 times more sugar than pico de gallo. While jelly bean contains 70g of sugar, pico de gallo contains only 6.25g.
Food varieties used in this article are Candies, jellybeans and PACE, Pico De Gallo.
Infographic
Infographic link
Mineral Comparison
Mineral comparison score is based on the number of minerals by which one or the other food is richer. The "coverage" charts below show how much of the daily needs can be covered by 300 grams of the food.
| Contains more MagnesiumMagnesium | +∞% |
| Contains more CalciumCalcium | +∞% |
| Contains more PotassiumPotassium | +∞% |
| Contains more IronIron | +∞% |
| Contains more CopperCopper | +∞% |
| Contains more ZincZinc | +∞% |
| Contains more PhosphorusPhosphorus | +∞% |
| Contains less SodiumSodium | -89.3% |
| Contains more ManganeseManganese | +∞% |
| Contains more SeleniumSelenium | +∞% |
Vitamin Comparison
Vitamin comparison score is based on the number of vitamins by which one or the other food is richer. The "coverage" charts below show how much of the daily needs can be covered by 300 grams of the food.
| Contains more Vitamin B1Vitamin B1 | +∞% |
| Contains more Vitamin B2Vitamin B2 | +∞% |
| Contains more Vitamin B3Vitamin B3 | +∞% |
| Contains more Vitamin B5Vitamin B5 | +∞% |
| Contains more Vitamin B6Vitamin B6 | +∞% |
| Contains more Vitamin CVitamin C | +∞% |
All nutrients comparison - raw data values
| Nutrient |  |
 |
DV% diff. |
| Carbs | 93.55g | 9.38g | 28% |
| Sodium | 50mg | 469mg | 18% |
| Calories | 375kcal | 31kcal | 17% |
| Vitamin C | 0mg | 3.8mg | 4% |
| Copper | 0.028mg | 3% | |
| Iron | 0.13mg | 0mg | 2% |
| Manganese | 0.035mg | 2% | |
| Selenium | 1.1µg | 2% | |
| Potassium | 37mg | 1% | |
| Fiber | 0.2g | 1% | |
| Phosphorus | 4mg | 1% | |
| Vitamin B2 | 0.011mg | 1% | |
| Fats | 0.05g | 0g | 0% |
| Net carbs | 93.35g | 9.38g | N/A |
| Magnesium | 2mg | 0% | |
| Calcium | 3mg | 0mg | 0% |
| Sugar | 70g | 6.25g | N/A |
| Zinc | 0.05mg | 0% | |
| Vitamin B1 | 0.004mg | 0% | |
| Vitamin B3 | 0.008mg | 0% | |
| Vitamin B5 | 0.009mg | 0% | |
| Vitamin B6 | 0.004mg | 0% |
Macronutrient Comparison
Macronutrient breakdown side-by-side comparison
Protein:
0 g
Fats:
0.05 g
Carbs:
93.55 g
Water:
6.3 g
Other:
0.1 g
Protein:
0 g
Fats:
0 g
Carbs:
9.38 g
Water:
88 g
Other:
2.62 g
| Contains more FatsFats | +∞% |
| Contains more CarbsCarbs | +897.3% |
| Contains more WaterWater | +1296.8% |
| Contains more OtherOther | +2520% |
~equal in
Protein
~0g


