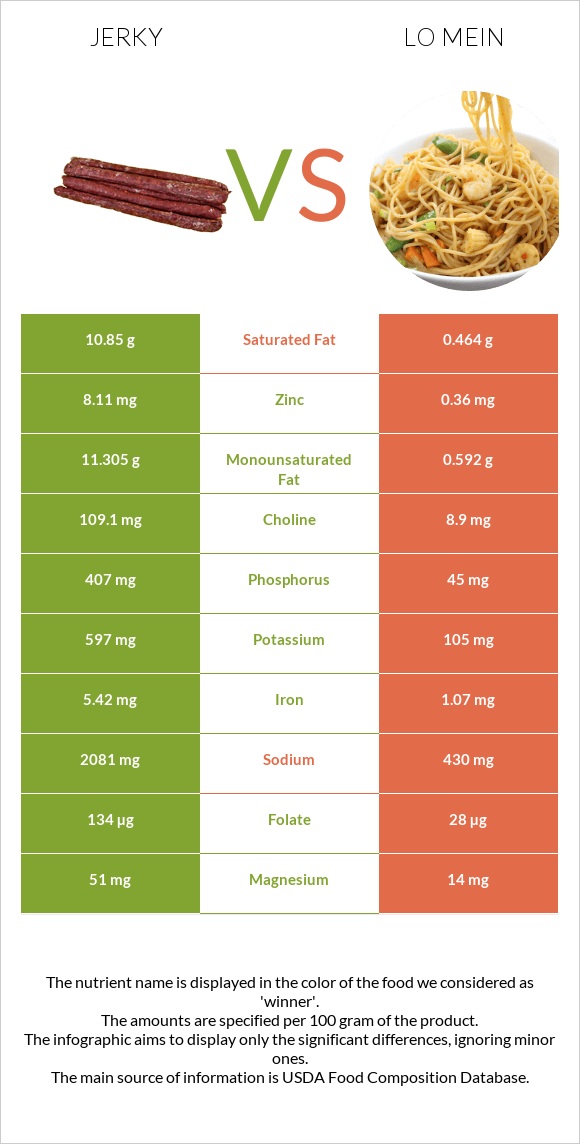
What are the differences between jerky and lo mein? Jerky is richer than lo mein in zinc, iron, phosphorus, vitamin B12, folate, choline, and copper. Jerky's daily need coverage for sodium is 72% more. The amount of cholesterol in lo mein is lower. We used Snacks, beef jerky, chopped, and formed and Restaurant, Chinese, vegetable lo mein, without meat types in this article.
Infographic
Mineral Comparison
Mineral comparison score is based on the number of minerals by which one or the other food is richer. The "coverage" charts below show how much of the daily needs can be covered by 300 grams of the food.
6
100 g
300 g
1 piece, large - 20g 1 oz - 28.35g 1 oz - 28.35g
Magnesium
Magnesium
Calcium
Calcium
Potassium
Potassium
Iron
Iron
Copper
Copper
Zinc
Zinc
Phosphorus
Phosphorus
Sodium
Sodium
Manganese
Manganese
Selenium
Selenium
36%
6%
53%
203%
76%
221%
174%
271%
14%
58%
2
100 g
300 g
1 cup - 136g 1 order - 741g
Magnesium
Magnesium
Calcium
Calcium
Potassium
Potassium
Iron
Iron
Copper
Copper
Zinc
Zinc
Phosphorus
Phosphorus
Sodium
Sodium
Manganese
Manganese
Selenium
Selenium
10%
6.3%
9.3%
40%
21%
9.8%
19%
56%
31%
64%
Vitamin Comparison
Vitamin comparison score is based on the number of vitamins by which one or the other food is richer. The "coverage" charts below show how much of the daily needs can be covered by 300 grams of the food.
8
100 g
300 g
1 piece, large - 20g 1 oz - 28.35g 1 oz - 28.35g
Vitamin C
Vit. C
Vitamin D
Vit. D
Vitamin A
Vit. A
Vitamin E
Vit. E
Vitamin B1
Vit. B1
Vitamin B2
Vit. B2
Vitamin B3
Vit. B3
Vitamin B5
Vit. B5
Vitamin B6
Vit. B6
Vitamin B12
Vit. B12
Vitamin K
Vit. K
Folate
Folate
0%
4.5%
0%
9.8%
39%
33%
32%
9.8%
41%
124%
5.8%
101%
4
100 g
300 g
1 cup - 136g 1 order - 741g
Vitamin C
Vit. C
Vitamin D
Vit. D
Vitamin A
Vit. A
Vitamin E
Vit. E
Vitamin B1
Vit. B1
Vitamin B2
Vit. B2
Vitamin B3
Vit. B3
Vitamin B5
Vit. B5
Vitamin B6
Vit. B6
Vitamin B12
Vit. B12
Vitamin K
Vit. K
Folate
Folate
5.7%
1.5%
3%
6%
12%
29%
15%
16%
16%
0%
32%
21%
All nutrients comparison - raw data values
Nutrient
DV% diff.
Sodium
2081mg
430mg
72%
Zinc
8.11mg
0.36mg
70%
Protein
33.2g
4.77g
57%
Iron
5.42mg
1.07mg
54%
Phosphorus
407mg
45mg
52%
Saturated fat
10.85g
0.464g
47%
Vitamin B12
0.99µg
0µg
41%
Fats
25.6g
2.35g
36%
Folate
134µg
28µg
27%
Monounsaturated fat
11.305g
0.592g
27%
Copper
0.227mg
0.064mg
18%
Choline
109.1mg
8.9mg
18%
Cholesterol
48mg
0mg
16%
Calories
410kcal
121kcal
14%
Potassium
597mg
105mg
14%
Magnesium
51mg
14mg
9%
Vitamin B1
0.154mg
0.047mg
9%
Vitamin B6
0.179mg
0.068mg
9%
Vitamin K
2.3µg
12.7µg
9%
Starch
16.73g
7%
Manganese
0.111mg
0.24mg
6%
Vitamin B3
1.732mg
0.81mg
6%
Carbs
11g
20.16g
3%
Vitamin C
0mg
1.7mg
2%
Fiber
1.8g
1.3g
2%
Selenium
10.7µg
11.7µg
2%
Vitamin B5
0.163mg
0.27mg
2%
Polyunsaturated fat
1.011g
1.291g
2%
Vitamin D*
11 IU
4 IU
1%
Vitamin D
0.3µg
0.1µg
1%
Vitamin A
0µg
9µg
1%
Vitamin E
0.49mg
0.3mg
1%
Vitamin B2
0.142mg
0.124mg
1%
Protein per 100 calories
8.1g
3.9g
N/A
Calories per 10 g protein
123kcal
254kcal
N/A
Weight per 100 calories
24g
83g
N/A
Unsaturated / Saturated Fat ratio
1.1
4.1
N/A
Net carbs
9.2g
18.86g
N/A
Calcium
20mg
21mg
0%
Sugar
9g
2.63g
N/A
Trans fat
0.008g
N/A
Fructose
0.33g
0%
Omega-3 - ALA
0.141g
N/A
Omega-6 - Gamma-linoleic acid
0.004g
N/A
Omega-6 - Eicosadienoic acid
0.001g
N/A
Omega-6 - Linoleic acid
1.134g
N/A
Macronutrient Comparison
Macronutrient breakdown side-by-side comparison
3
33%
26%
11%
23%
7%
Protein:
33.2 g
Fats:
25.6 g
Carbs:
11 g
Water:
23.36 g
Other:
6.84 g
2
5%
2%
20%
71%
Protein:
4.77 g
Fats:
2.35 g
Carbs:
20.16 g
Water:
71.33 g
Other:
1.39 g
Contains
more
Protein Protein
+596%
Contains
more
Fats Fats
+989.4%
Contains
more
Other Other
+392.1%
Contains
more
Carbs Carbs
+83.3%
Contains
more
Water Water
+205.4%
Fat Type Comparison
Fat type breakdown side-by-side comparison
1
47%
49%
4%
Saturated fat:
Sat. Fat
10.85 g
Monounsaturated fat:
Mono. Fat
11.305 g
Polyunsaturated fat:
Poly. Fat
1.011 g
2
20%
25%
55%
Saturated fat:
Sat. Fat
0.464 g
Monounsaturated fat:
Mono. Fat
0.592 g
Polyunsaturated fat:
Poly. Fat
1.291 g
Contains
more
Mono. Fat Monounsaturated fat
+1809.6%
Contains
less
Sat. Fat Saturated fat
-95.7%
Contains
more
Poly. Fat Polyunsaturated fat
+27.7%