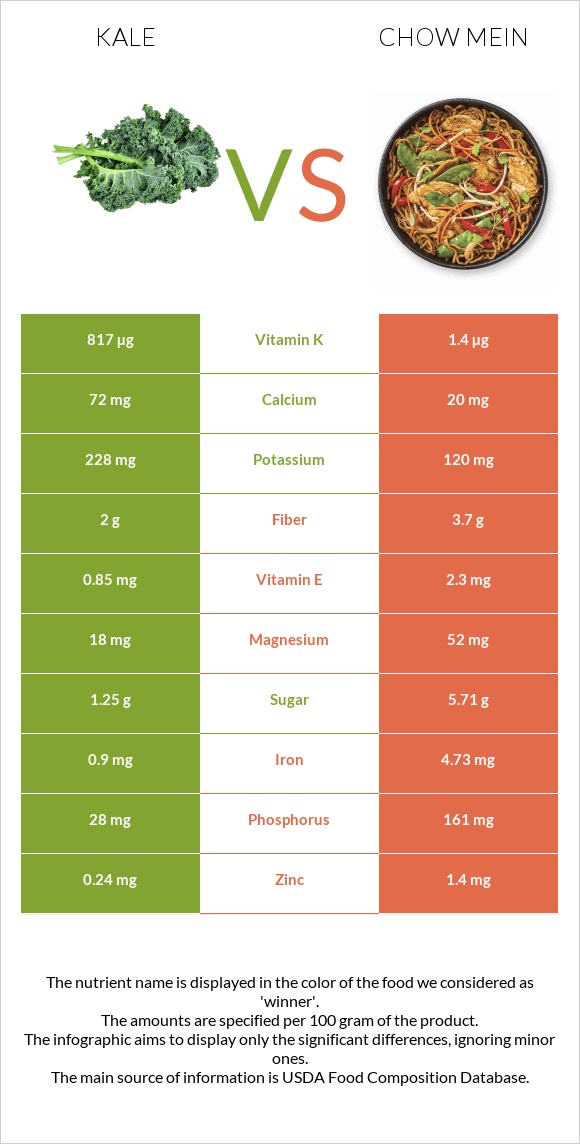
What are the differences between kale and chow mein? Kale is higher in vitamin K, vitamin A, and vitamin C, yet chow mein is higher in selenium, iron, vitamin B1, vitamin B3, vitamin B2, and folate. Kale's daily need coverage for vitamin K is 680% more. The amount of sodium in kale is lower. We used Kale, cooked, boiled, drained, without salt and Noodles, chinese, chow mein types in this article.
Infographic
Mineral Comparison
Mineral comparison score is based on the number of minerals by which one or the other food is richer. The "coverage" charts below show how much of the daily needs can be covered by 300 grams of the food.
4
100 g
300 g
1 cup, chopped - 130g
Magnesium
Magnesium
Calcium
Calcium
Potassium
Potassium
Iron
Iron
Copper
Copper
Zinc
Zinc
Phosphorus
Phosphorus
Sodium
Sodium
Manganese
Manganese
Selenium
Selenium
13%
22%
20%
34%
52%
6.5%
12%
3%
54%
4.9%
5
100 g
300 g
0.5 cup dry - 28g 1.5 oz - 43g
Magnesium
Magnesium
Calcium
Calcium
Potassium
Potassium
Iron
Iron
Copper
Copper
Zinc
Zinc
Phosphorus
Phosphorus
Sodium
Sodium
Manganese
Manganese
Selenium
Selenium
37%
6%
11%
177%
56%
38%
69%
153%
0%
235%
Vitamin Comparison
Vitamin comparison score is based on the number of vitamins by which one or the other food is richer. The "coverage" charts below show how much of the daily needs can be covered by 300 grams of the food.
4
100 g
300 g
1 cup, chopped - 130g
Vitamin C
Vit. C
Vitamin D
Vit. D
Vitamin A
Vit. A
Vitamin E
Vit. E
Vitamin B1
Vit. B1
Vitamin B2
Vit. B2
Vitamin B3
Vit. B3
Vitamin B5
Vit. B5
Vitamin B6
Vit. B6
Vitamin B12
Vit. B12
Vitamin K
Vit. K
Folate
Folate
137%
0%
227%
17%
13%
16%
9.4%
2.9%
32%
0%
2043%
9.8%
6
100 g
300 g
0.5 cup dry - 28g 1.5 oz - 43g
Vitamin C
Vit. C
Vitamin D
Vit. D
Vitamin A
Vit. A
Vitamin E
Vit. E
Vitamin B1
Vit. B1
Vitamin B2
Vit. B2
Vitamin B3
Vit. B3
Vitamin B5
Vit. B5
Vitamin B6
Vit. B6
Vitamin B12
Vit. B12
Vitamin K
Vit. K
Folate
Folate
0%
0%
0%
46%
145%
97%
112%
32%
25%
0%
3.5%
80%
All nutrients comparison - raw data values
Nutrient
DV% diff.
Vitamin K
817µg
1.4µg
680%
Selenium
0.9µg
43µg
77%
Vitamin A
681µg
0µg
76%
Sodium
23mg
1174mg
50%
Iron
0.9mg
4.73mg
48%
Vitamin C
41mg
0mg
46%
Vitamin B1
0.053mg
0.578mg
44%
Vitamin B3
0.5mg
5.95mg
34%
Vitamin B2
0.07mg
0.421mg
27%
Fats
0.4g
15.43g
23%
Folate
13µg
106µg
23%
Polyunsaturated fat
0.193g
3.571g
23%
Calories
28kcal
475kcal
22%
Carbs
5.63g
72.8g
22%
Monounsaturated fat
0.03g
8.929g
22%
Phosphorus
28mg
161mg
19%
Manganese
0.416mg
18%
Protein
1.9g
8.11g
12%
Zinc
0.24mg
1.4mg
11%
Vitamin E
0.85mg
2.3mg
10%
Vitamin B5
0.049mg
0.533mg
10%
Saturated fat
0.052g
2.229g
10%
Magnesium
18mg
52mg
8%
Fiber
2g
3.7g
7%
Calcium
72mg
20mg
5%
Potassium
228mg
120mg
3%
Vitamin B6
0.138mg
0.11mg
2%
Choline
0.4mg
8.7mg
2%
Copper
0.156mg
0.167mg
1%
Protein per 100 calories
6.8g
1.7g
N/A
Calories per 10 g protein
147kcal
586kcal
N/A
Weight per 100 calories
357g
21g
N/A
Unsaturated / Saturated Fat ratio
4.3
5.6
N/A
Net carbs
3.63g
69.1g
N/A
Sugar
1.25g
5.71g
N/A
Trans fat
0g
0.8g
N/A
Tryptophan
0.023mg
0%
Threonine
0.085mg
0%
Isoleucine
0.114mg
0%
Leucine
0.133mg
0%
Lysine
0.114mg
0%
Methionine
0.018mg
0%
Phenylalanine
0.097mg
0%
Valine
0.104mg
0%
Histidine
0.04mg
0%
Macronutrient Comparison
Macronutrient breakdown side-by-side comparison
1
2%
6%
91%
Protein:
1.9 g
Fats:
0.4 g
Carbs:
5.63 g
Water:
91.2 g
Other:
0.87 g
4
8%
15%
73%
2%
Protein:
8.11 g
Fats:
15.43 g
Carbs:
72.8 g
Water:
1.18 g
Other:
2.48 g
Contains
more
Water Water
+7628.8%
Contains
more
Protein Protein
+326.8%
Contains
more
Fats Fats
+3757.5%
Contains
more
Carbs Carbs
+1193.1%
Contains
more
Other Other
+185.1%
Fat Type Comparison
Fat type breakdown side-by-side comparison
1
19%
11%
70%
Saturated fat:
Sat. Fat
0.052 g
Monounsaturated fat:
Mono. Fat
0.03 g
Polyunsaturated fat:
Poly. Fat
0.193 g
2
15%
61%
24%
Saturated fat:
Sat. Fat
2.229 g
Monounsaturated fat:
Mono. Fat
8.929 g
Polyunsaturated fat:
Poly. Fat
3.571 g
Contains
less
Sat. Fat Saturated fat
-97.7%
Contains
more
Mono. Fat Monounsaturated fat
+29663.3%
Contains
more
Poly. Fat Polyunsaturated fat
+1750.3%