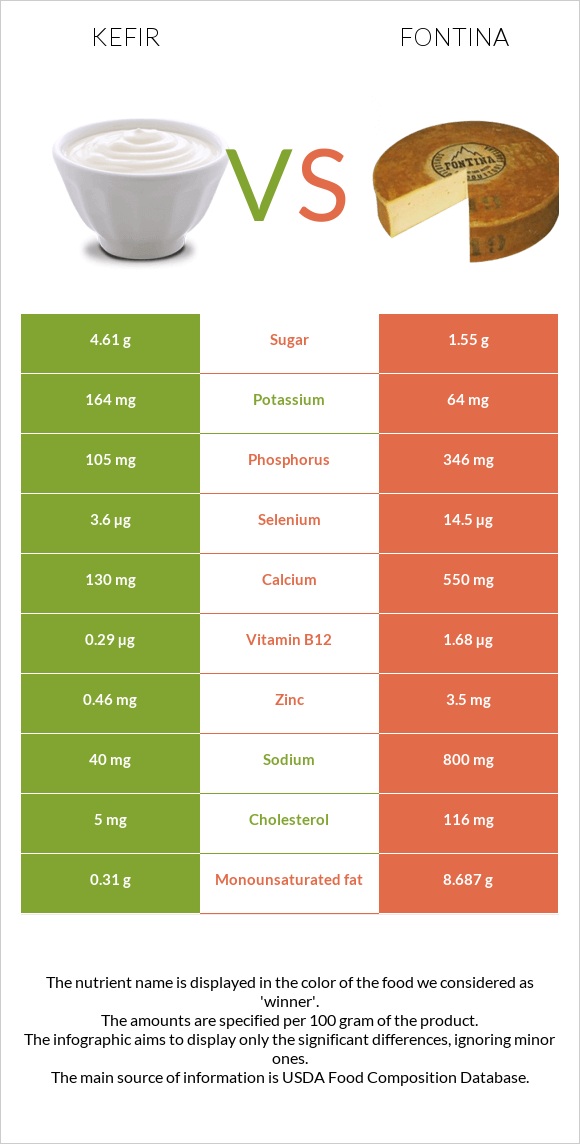
How are kefir and fontina different? Fontina has more vitamin B12, calcium, phosphorus, zinc, selenium, vitamin A, and vitamin B2 than kefir. Daily need coverage for saturated fat for fontina is 93% higher. Kefir has less sodium. Kefir, lowfat, plain, LIFEWAY and Cheese, fontina are the varieties used in this article.
Infographic
Mineral Comparison
Mineral comparison score is based on the number of minerals by which one or the other food is richer. The "coverage" charts below show how much of the daily needs can be covered by 300 grams of the food.
2
100 g
300 g
Magnesium
Magnesium
Calcium
Calcium
Potassium
Potassium
Iron
Iron
Copper
Copper
Zinc
Zinc
Phosphorus
Phosphorus
Sodium
Sodium
Manganese
Manganese
Selenium
Selenium
8.6%
39%
14%
1.5%
3%
13%
45%
5.2%
0.65%
20%
8
100 g
300 g
1 cubic inch - 15g 1 slice (1 oz) - 28g 1 oz - 28.35g 1 cup, shredded - 108g 1 cup, diced - 132g 1 package (8 oz) - 227g
Magnesium
Magnesium
Calcium
Calcium
Potassium
Potassium
Iron
Iron
Copper
Copper
Zinc
Zinc
Phosphorus
Phosphorus
Sodium
Sodium
Manganese
Manganese
Selenium
Selenium
10%
165%
5.6%
8.6%
8.3%
95%
148%
104%
1.8%
79%
Vitamin Comparison
Vitamin comparison score is based on the number of vitamins by which one or the other food is richer. The "coverage" charts below show how much of the daily needs can be covered by 300 grams of the food.
4
100 g
300 g
Vitamin C
Vit. C
Vitamin D
Vit. D
Vitamin A
Vit. A
Vitamin E
Vit. E
Vitamin B1
Vit. B1
Vitamin B2
Vit. B2
Vitamin B3
Vit. B3
Vitamin B5
Vit. B5
Vitamin B6
Vit. B6
Vitamin B12
Vit. B12
Vitamin K
Vit. K
Folate
Folate
0.67%
15%
57%
0.4%
7.5%
31%
2.8%
23%
13%
36%
0.25%
9.8%
7
100 g
300 g
1 cubic inch - 15g 1 slice (1 oz) - 28g 1 oz - 28.35g 1 cup, shredded - 108g 1 cup, diced - 132g 1 package (8 oz) - 227g
Vitamin C
Vit. C
Vitamin D
Vit. D
Vitamin A
Vit. A
Vitamin E
Vit. E
Vitamin B1
Vit. B1
Vitamin B2
Vit. B2
Vitamin B3
Vit. B3
Vitamin B5
Vit. B5
Vitamin B6
Vit. B6
Vitamin B12
Vit. B12
Vitamin K
Vit. K
Folate
Folate
0%
9%
87%
5.4%
5.3%
47%
2.8%
26%
19%
210%
6.5%
4.5%
All nutrients comparison - raw data values
Nutrient
DV% diff.
Saturated fat
0.658g
19.196g
84%
Vitamin B12
0.29µg
1.68µg
58%
Fats
0.93g
31.14g
46%
Protein
3.79g
25.6g
44%
Calcium
130mg
550mg
42%
Cholesterol
5mg
116mg
37%
Phosphorus
105mg
346mg
34%
Sodium
40mg
800mg
33%
Zinc
0.46mg
3.5mg
28%
Monounsaturated fat
0.31g
8.687g
21%
Selenium
3.6µg
14.5µg
20%
Calories
41kcal
389kcal
17%
Polyunsaturated fat
0.053g
1.654g
11%
Vitamin A
171µg
261µg
10%
Vitamin B2
0.135mg
0.204mg
5%
Potassium
164mg
64mg
3%
Vitamin D*
41 IU
23 IU
2%
Vitamin D
1µg
0.6µg
2%
Iron
0.04mg
0.23mg
2%
Copper
0.009mg
0.025mg
2%
Vitamin E
0.02mg
0.27mg
2%
Vitamin B6
0.058mg
0.083mg
2%
Vitamin K
0.1µg
2.6µg
2%
Folate
13µg
6µg
2%
Carbs
4.48g
1.55g
1%
Vitamin B1
0.03mg
0.021mg
1%
Vitamin B5
0.385mg
0.429mg
1%
Protein per 100 calories
9.2g
6.6g
N/A
Calories per 10 g protein
108kcal
152kcal
N/A
Weight per 100 calories
244g
26g
N/A
Unsaturated / Saturated Fat ratio
0.55
0.54
N/A
Vitamin C
0.2mg
0mg
0%
Net carbs
4.48g
1.55g
N/A
Magnesium
12mg
14mg
0%
Sugar
4.61g
1.55g
N/A
Manganese
0.005mg
0.014mg
0%
Vitamin B3
0.15mg
0.15mg
0%
Trans fat
0.037g
N/A
Choline
15.2mg
15.4mg
0%
Tryptophan
0.361mg
0%
Threonine
0.935mg
0%
Isoleucine
1.384mg
0%
Leucine
2.664mg
0%
Lysine
2.328mg
0%
Methionine
0.706mg
0%
Phenylalanine
1.497mg
0%
Valine
1.926mg
0%
Histidine
0.959mg
0%
Omega-3 - ALA
0.006g
N/A
Omega-3 - DPA
0.001g
0g
N/A
Omega-6 - Dihomo-gamma-linoleic acid
0.002g
N/A
Omega-6 - Linoleic acid
0.029g
N/A
Macronutrient Comparison
Macronutrient breakdown side-by-side comparison
2
4%
4%
90%
Protein:
3.79 g
Fats:
0.93 g
Carbs:
4.48 g
Water:
90.07 g
Other:
0.73 g
3
26%
31%
38%
4%
Protein:
25.6 g
Fats:
31.14 g
Carbs:
1.55 g
Water:
37.92 g
Other:
3.79 g
Contains
more
Carbs Carbs
+189%
Contains
more
Water Water
+137.5%
Contains
more
Protein Protein
+575.5%
Contains
more
Fats Fats
+3248.4%
Contains
more
Other Other
+419.2%
Fat Type Comparison
Fat type breakdown side-by-side comparison
1
64%
30%
5%
Saturated fat:
Sat. Fat
0.658 g
Monounsaturated fat:
Mono. Fat
0.31 g
Polyunsaturated fat:
Poly. Fat
0.053 g
2
65%
29%
6%
Saturated fat:
Sat. Fat
19.196 g
Monounsaturated fat:
Mono. Fat
8.687 g
Polyunsaturated fat:
Poly. Fat
1.654 g
Contains
less
Sat. Fat Saturated fat
-96.6%
Contains
more
Mono. Fat Monounsaturated fat
+2702.3%
Contains
more
Poly. Fat Polyunsaturated fat
+3020.8%