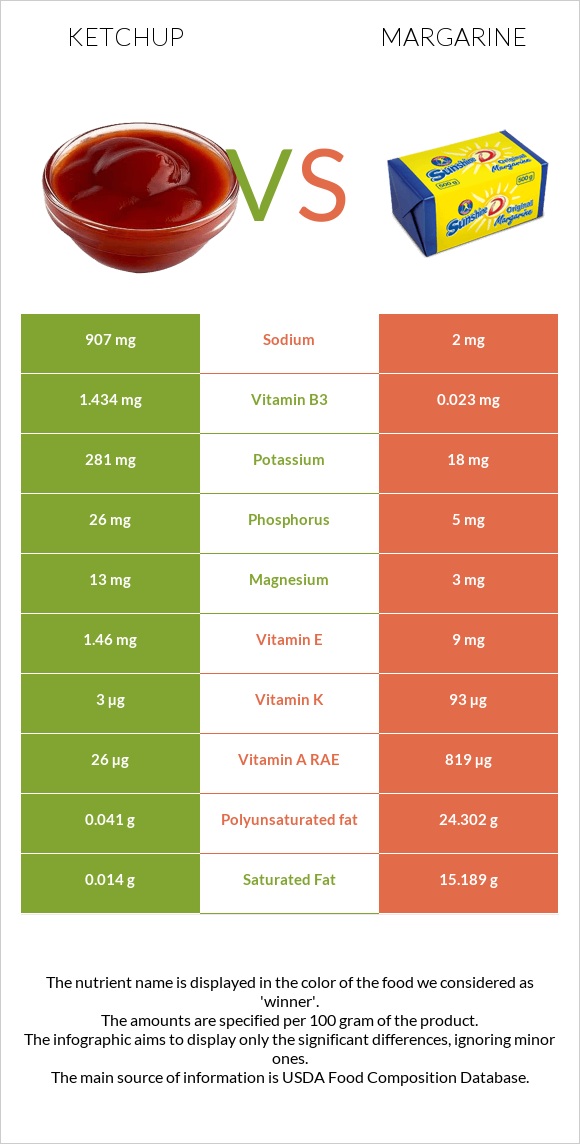
Important differences between ketchup and margarine Ketchup has more vitamin B6, vitamin B2, copper, vitamin B3, and potassium; however, margarine has more vitamin K, vitamin A, and vitamin E. Margarine's daily need coverage for saturated fat is 76% more. Margarine is lower in sodium. The food varieties used in the comparison are Catsup and Margarine, regular, 80% fat, composite, stick, without salt .
Infographic
Mineral Comparison
Mineral comparison score is based on the number of minerals by which one or the other food is richer. The "coverage" charts below show how much of the daily needs can be covered by 300 grams of the food.
9
100 g
300 g
1 packet - 9g 1 tbsp - 17g 1 cup - 240g
Magnesium
Magnesium
Calcium
Calcium
Potassium
Potassium
Iron
Iron
Copper
Copper
Zinc
Zinc
Phosphorus
Phosphorus
Sodium
Sodium
Manganese
Manganese
Selenium
Selenium
9.3%
4.5%
25%
13%
28%
4.6%
11%
118%
11%
3.8%
1
100 g
300 g
1 pat (1" sq, 1/3" high) - 5g 1 tbsp - 14.2g 1 stick - 113g 1 cup - 227g
Magnesium
Magnesium
Calcium
Calcium
Potassium
Potassium
Iron
Iron
Copper
Copper
Zinc
Zinc
Phosphorus
Phosphorus
Sodium
Sodium
Manganese
Manganese
Selenium
Selenium
2.1%
0.9%
1.6%
2.3%
0%
0%
2.1%
0.26%
0%
0%
Vitamin Comparison
Vitamin comparison score is based on the number of vitamins by which one or the other food is richer. The "coverage" charts below show how much of the daily needs can be covered by 300 grams of the food.
6
100 g
300 g
1 packet - 9g 1 tbsp - 17g 1 cup - 240g
Vitamin C
Vit. C
Vitamin D
Vit. D
Vitamin A
Vit. A
Vitamin E
Vit. E
Vitamin B1
Vit. B1
Vitamin B2
Vit. B2
Vitamin B3
Vit. B3
Vitamin B5
Vit. B5
Vitamin B6
Vit. B6
Vitamin B12
Vit. B12
Vitamin K
Vit. K
Folate
Folate
14%
0%
8.7%
29%
2.8%
38%
27%
2.8%
36%
0%
7.5%
6.8%
4
100 g
300 g
1 pat (1" sq, 1/3" high) - 5g 1 tbsp - 14.2g 1 stick - 113g 1 cup - 227g
Vitamin C
Vit. C
Vitamin D
Vit. D
Vitamin A
Vit. A
Vitamin E
Vit. E
Vitamin B1
Vit. B1
Vitamin B2
Vit. B2
Vitamin B3
Vit. B3
Vitamin B5
Vit. B5
Vitamin B6
Vit. B6
Vitamin B12
Vit. B12
Vitamin K
Vit. K
Folate
Folate
0.67%
0%
273%
180%
2.5%
8.5%
0.43%
0%
2.1%
13%
233%
0.75%
All nutrients comparison - raw data values
Nutrient
DV% diff.
Polyunsaturated fat
0.041g
24.302g
162%
Fats
0.1g
80.71g
124%
Monounsaturated fat
0.015g
38.877g
97%
Vitamin A
26µg
819µg
88%
Vitamin K
3µg
93µg
75%
Saturated fat
0.014g
15.189g
69%
Vitamin E
1.46mg
9mg
50%
Sodium
907mg
2mg
39%
Calories
101kcal
717kcal
31%
Vitamin B6
0.158mg
0.009mg
11%
Fructose
8.72g
11%
Vitamin B2
0.166mg
0.037mg
10%
Carbs
27.4g
0.7g
9%
Copper
0.085mg
0mg
9%
Vitamin B3
1.434mg
0.023mg
9%
Potassium
281mg
18mg
8%
Vitamin C
4.1mg
0.2mg
4%
Iron
0.35mg
0.06mg
4%
Manganese
0.084mg
4%
Vitamin B12
0µg
0.1µg
4%
Phosphorus
26mg
5mg
3%
Protein
1.04g
0.16g
2%
Magnesium
13mg
3mg
2%
Zinc
0.17mg
0mg
2%
Folate
9µg
1µg
2%
Calcium
15mg
3mg
1%
Fiber
0.3g
0g
1%
Selenium
0.7µg
0µg
1%
Vitamin B5
0.047mg
1%
Protein per 100 calories
1g
0.02g
N/A
Calories per 10 g protein
971kcal
44813kcal
N/A
Weight per 100 calories
99g
14g
N/A
Unsaturated / Saturated Fat ratio
4
4.2
N/A
Net carbs
27.1g
0.7g
N/A
Sugar
21.27g
0g
N/A
Vitamin B1
0.011mg
0.01mg
0%
Trans fat
0g
14.89g
N/A
Choline
12.5mg
12.4mg
0%
Tryptophan
0.005mg
0%
Threonine
0.019mg
0%
Isoleucine
0.014mg
0%
Leucine
0.021mg
0%
Lysine
0.023mg
0%
Methionine
0.005mg
0%
Phenylalanine
0.021mg
0%
Valine
0.014mg
0%
Histidine
0.013mg
0%
Omega-3 - DPA
0g
0.006g
N/A
Omega-6 - Linoleic acid
21.522g
N/A
Macronutrient Comparison
Macronutrient breakdown side-by-side comparison
4
27%
69%
3%
Protein:
1.04 g
Fats:
0.1 g
Carbs:
27.4 g
Water:
68.51 g
Other:
2.95 g
1
81%
17%
2%
Protein:
0.16 g
Fats:
80.71 g
Carbs:
0.7 g
Water:
16.52 g
Other:
1.91 g
Contains
more
Protein Protein
+550%
Contains
more
Carbs Carbs
+3814.3%
Contains
more
Water Water
+314.7%
Contains
more
Other Other
+54.5%
Contains
more
Fats Fats
+80610%
Fat Type Comparison
Fat type breakdown side-by-side comparison
1
20%
21%
59%
Saturated fat:
Sat. Fat
0.014 g
Monounsaturated fat:
Mono. Fat
0.015 g
Polyunsaturated fat:
Poly. Fat
0.041 g
2
19%
50%
31%
Saturated fat:
Sat. Fat
15.189 g
Monounsaturated fat:
Mono. Fat
38.877 g
Polyunsaturated fat:
Poly. Fat
24.302 g
Contains
less
Sat. Fat Saturated fat
-99.9%
Contains
more
Mono. Fat Monounsaturated fat
+259080%
Contains
more
Poly. Fat Polyunsaturated fat
+59173.2%