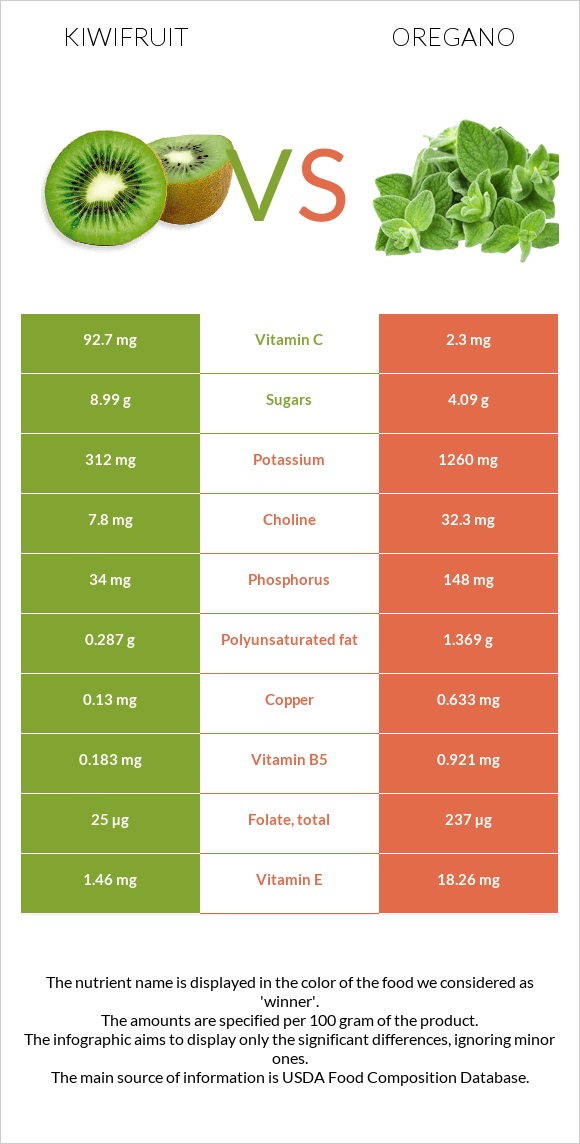
A recap on the differences between kiwi and oregano Kiwi is higher in vitamin C, yet oregano is higher in vitamin K, iron, manganese, fiber, calcium, vitamin E, vitamin B6, magnesium, and copper. Oregano covers your daily vitamin K needs 484% more than kiwi. Kiwi contains 40 times more vitamin C than oregano. While kiwi contains 92.7mg of vitamin C, oregano contains only 2.3mg. The glycemic index of oregano is lower. Food varieties used in this article are Kiwifruit, green, raw and Spices, oregano, dried .
Infographic
Mineral Comparison
Mineral comparison score is based on the number of minerals by which one or the other food is richer. The "coverage" charts below show how much of the daily needs can be covered by 300 grams of the food.
1
100 g
300 g
1 fruit (2" dia) - 69g 1 NLEA serving - 148g 1 cup, sliced - 180g
Magnesium
Magnesium
Calcium
Calcium
Potassium
Potassium
Iron
Iron
Copper
Copper
Zinc
Zinc
Phosphorus
Phosphorus
Sodium
Sodium
Manganese
Manganese
Selenium
Selenium
12%
10%
28%
12%
43%
3.8%
15%
0.39%
13%
1.1%
9
100 g
300 g
0.25 tsp - 0.5g 1 tsp, ground - 1.8g
Magnesium
Magnesium
Calcium
Calcium
Potassium
Potassium
Iron
Iron
Copper
Copper
Zinc
Zinc
Phosphorus
Phosphorus
Sodium
Sodium
Manganese
Manganese
Selenium
Selenium
193%
479%
111%
1380%
211%
73%
63%
3.3%
651%
25%
Vitamin Comparison
Vitamin comparison score is based on the number of vitamins by which one or the other food is richer. The "coverage" charts below show how much of the daily needs can be covered by 300 grams of the food.
1
100 g
300 g
1 fruit (2" dia) - 69g 1 NLEA serving - 148g 1 cup, sliced - 180g
Vitamin C
Vit. C
Vitamin D
Vit. D
Vitamin A
Vit. A
Vitamin E
Vit. E
Vitamin B1
Vit. B1
Vitamin B2
Vit. B2
Vitamin B3
Vit. B3
Vitamin B5
Vit. B5
Vitamin B6
Vit. B6
Vitamin B12
Vit. B12
Vitamin K
Vit. K
Folate
Folate
309%
0%
1.3%
29%
6.8%
5.8%
6.4%
11%
15%
0%
101%
19%
9
100 g
300 g
0.25 tsp - 0.5g 1 tsp, ground - 1.8g
Vitamin C
Vit. C
Vitamin D
Vit. D
Vitamin A
Vit. A
Vitamin E
Vit. E
Vitamin B1
Vit. B1
Vitamin B2
Vit. B2
Vitamin B3
Vit. B3
Vitamin B5
Vit. B5
Vitamin B6
Vit. B6
Vitamin B12
Vit. B12
Vitamin K
Vit. K
Folate
Folate
7.7%
0%
28%
365%
44%
122%
87%
55%
241%
0%
1554%
178%
All nutrients comparison - raw data values
Nutrient
DV% diff.
Vitamin K
40.3µg
621.7µg
485%
Iron
0.31mg
36.8mg
456%
Manganese
0.098mg
4.99mg
213%
Fiber
3g
42.5g
158%
Calcium
34mg
1597mg
156%
Vitamin E
1.46mg
18.26mg
112%
Vitamin C
92.7mg
2.3mg
100%
Vitamin B6
0.063mg
1.044mg
75%
Magnesium
17mg
270mg
60%
Copper
0.13mg
0.633mg
56%
Folate
25µg
237µg
53%
Vitamin B2
0.025mg
0.528mg
39%
Potassium
312mg
1260mg
28%
Vitamin B3
0.341mg
4.64mg
27%
Zinc
0.14mg
2.69mg
23%
Carbs
14.66g
68.92g
18%
Protein
1.14g
9g
16%
Phosphorus
34mg
148mg
16%
Vitamin B5
0.183mg
0.921mg
15%
Vitamin B1
0.027mg
0.177mg
13%
Calories
61kcal
265kcal
10%
Vitamin A
4µg
85µg
9%
Selenium
0.2µg
4.5µg
8%
Saturated fat
0.029g
1.551g
7%
Polyunsaturated fat
0.287g
1.369g
7%
Fats
0.52g
4.28g
6%
Choline
7.8mg
32.3mg
4%
Fructose
4.35g
1.13g
4%
Monounsaturated fat
0.047g
0.716g
2%
Sodium
3mg
25mg
1%
Protein per 100 calories
1.9g
3.4g
N/A
Calories per 10 g protein
535kcal
294kcal
N/A
Weight per 100 calories
164g
38g
N/A
Unsaturated / Saturated Fat ratio
12
1.3
N/A
Net carbs
11.66g
26.42g
N/A
Sugar
8.99g
4.09g
N/A
Tryptophan
0.015mg
0.203mg
0%
Threonine
0.047mg
0.322mg
0%
Isoleucine
0.051mg
0.441mg
0%
Leucine
0.066mg
0.78mg
0%
Lysine
0.061mg
0.5mg
0%
Methionine
0.024mg
0.127mg
0%
Phenylalanine
0.044mg
0.449mg
0%
Valine
0.057mg
0.585mg
0%
Histidine
0.027mg
0.144mg
0%
Omega-3 - ALA
0.621g
N/A
Macronutrient Comparison
Macronutrient breakdown side-by-side comparison
1
15%
83%
Protein:
1.14 g
Fats:
0.52 g
Carbs:
14.66 g
Water:
83.07 g
Other:
0.61 g
4
9%
4%
69%
10%
8%
Protein:
9 g
Fats:
4.28 g
Carbs:
68.92 g
Water:
9.93 g
Other:
7.87 g
Contains
more
Water Water
+736.6%
Contains
more
Protein Protein
+689.5%
Contains
more
Fats Fats
+723.1%
Contains
more
Carbs Carbs
+370.1%
Contains
more
Other Other
+1190.2%
Fat Type Comparison
Fat type breakdown side-by-side comparison
1
8%
13%
79%
Saturated fat:
Sat. Fat
0.029 g
Monounsaturated fat:
Mono. Fat
0.047 g
Polyunsaturated fat:
Poly. Fat
0.287 g
2
43%
20%
38%
Saturated fat:
Sat. Fat
1.551 g
Monounsaturated fat:
Mono. Fat
0.716 g
Polyunsaturated fat:
Poly. Fat
1.369 g
Contains
less
Sat. Fat Saturated fat
-98.1%
Contains
more
Mono. Fat Monounsaturated fat
+1423.4%
Contains
more
Poly. Fat Polyunsaturated fat
+377%
Carbohydrate type comparison
Carbohydrate type breakdown side-by-side comparison
4
2%
46%
48%
2%
2%
Starch:
0 g
Sucrose:
0.15 g
Glucose:
4.11 g
Fructose:
4.35 g
Lactose:
0 g
Maltose:
0.19 g
Galactose:
0.17 g
1
22%
46%
28%
4%
Starch:
0 g
Sucrose:
0.91 g
Glucose:
1.9 g
Fructose:
1.13 g
Lactose:
0 g
Maltose:
0 g
Galactose:
0.15 g
Contains
more
Glucose Glucose
+116.3%
Contains
more
Fructose Fructose
+285%
Contains
more
Maltose Maltose
+∞%
Contains
more
Galactose Galactose
+13.3%
Contains
more
Sucrose Sucrose
+506.7%
~equal in
Starch
~0g
~equal in
Lactose
~0g