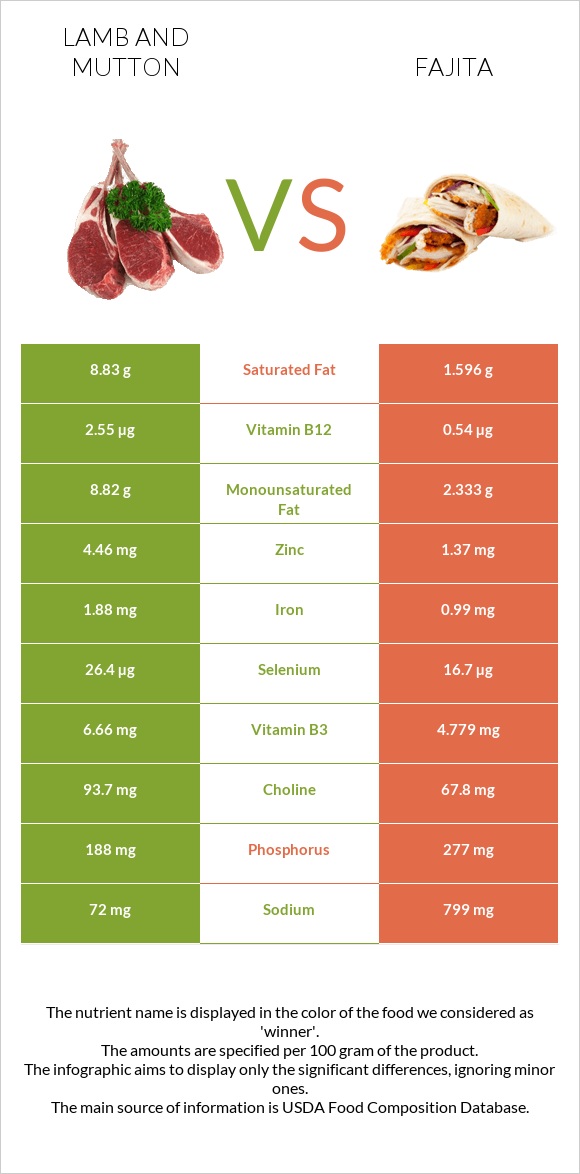
A recap on the differences between lamb and fajita Lamb has more vitamin B12, zinc, selenium, vitamin B3, iron, and copper; however, fajita is higher in vitamin B6 and phosphorus. Lamb covers your daily vitamin B12 needs 84% more than fajita. Fajita contains 6 times less saturated fat than lamb. Lamb contains 8.83g of saturated fat, while fajita contains 1.596g. The glycemic index of fajita is higher. Food varieties used in this article are Lamb, domestic, composite of trimmed retail cuts, separable lean, and fat, trimmed to 1/4" fat, choice, cooked and USDA Commodity, chicken fajita strips, frozen .
Infographic
Mineral Comparison
Mineral comparison score is based on the number of minerals by which one or the other food is richer. The "coverage" charts below show how much of the daily needs can be covered by 300 grams of the food.
6
100 g
300 g
3 oz - 85g 1 piece, cooked, excluding refuse (yield from 1 lb raw meat with refuse) - 242g
Magnesium
Magnesium
Calcium
Calcium
Potassium
Potassium
Iron
Iron
Copper
Copper
Zinc
Zinc
Phosphorus
Phosphorus
Sodium
Sodium
Manganese
Manganese
Selenium
Selenium
16%
5.1%
27%
71%
40%
122%
81%
9.4%
2.9%
144%
2
100 g
300 g
1 strip - 9.4g
Magnesium
Magnesium
Calcium
Calcium
Potassium
Potassium
Iron
Iron
Copper
Copper
Zinc
Zinc
Phosphorus
Phosphorus
Sodium
Sodium
Manganese
Manganese
Selenium
Selenium
16%
3.9%
25%
37%
10%
37%
119%
104%
8.6%
91%
Vitamin Comparison
Vitamin comparison score is based on the number of vitamins by which one or the other food is richer. The "coverage" charts below show how much of the daily needs can be covered by 300 grams of the food.
6
100 g
300 g
3 oz - 85g 1 piece, cooked, excluding refuse (yield from 1 lb raw meat with refuse) - 242g
Vitamin C
Vit. C
Vitamin D
Vit. D
Vitamin A
Vit. A
Vitamin E
Vit. E
Vitamin B1
Vit. B1
Vitamin B2
Vit. B2
Vitamin B3
Vit. B3
Vitamin B5
Vit. B5
Vitamin B6
Vit. B6
Vitamin B12
Vit. B12
Vitamin K
Vit. K
Folate
Folate
0%
1.5%
0%
2.8%
25%
58%
125%
40%
30%
319%
12%
14%
2
100 g
300 g
1 strip - 9.4g
Vitamin C
Vit. C
Vitamin D
Vit. D
Vitamin A
Vit. A
Vitamin E
Vit. E
Vitamin B1
Vit. B1
Vitamin B2
Vit. B2
Vitamin B3
Vit. B3
Vitamin B5
Vit. B5
Vitamin B6
Vit. B6
Vitamin B12
Vit. B12
Vitamin K
Vit. K
Folate
Folate
0%
0%
0%
4.4%
25%
49%
90%
44%
89%
68%
0.5%
3%
All nutrients comparison - raw data values
Nutrient
DV% diff.
Vitamin B12
2.55µg
0.54µg
84%
Saturated fat
8.83g
1.596g
33%
Sodium
72mg
799mg
32%
Zinc
4.46mg
1.37mg
28%
Fats
20.94g
5.73g
23%
Vitamin B6
0.13mg
0.387mg
20%
Selenium
26.4µg
16.7µg
18%
Monounsaturated fat
8.82g
2.333g
16%
Phosphorus
188mg
277mg
13%
Protein
24.52g
18.56g
12%
Vitamin B3
6.66mg
4.779mg
12%
Iron
1.88mg
0.99mg
11%
Copper
0.119mg
0.03mg
10%
Calories
294kcal
135kcal
8%
Choline
93.7mg
67.8mg
5%
Vitamin K
4.6µg
0.2µg
4%
Folate
18µg
4µg
4%
Cholesterol
97mg
88mg
3%
Vitamin B2
0.25mg
0.213mg
3%
Polyunsaturated fat
1.51g
1.089g
3%
Manganese
0.022mg
0.066mg
2%
Carbs
0g
2.23g
1%
Vitamin D
0.1µg
1%
Potassium
310mg
284mg
1%
Vitamin E
0.14mg
0.22mg
1%
Vitamin B5
0.66mg
0.726mg
1%
Protein per 100 calories
8.3g
14g
N/A
Calories per 10 g protein
120kcal
73kcal
N/A
Weight per 100 calories
34g
74g
N/A
Unsaturated / Saturated Fat ratio
1.2
2.1
N/A
Net carbs
0g
2.23g
N/A
Vitamin D*
2 IU
0%
Magnesium
23mg
22mg
0%
Calcium
17mg
13mg
0%
Vitamin B1
0.1mg
0.1mg
0%
Tryptophan
0.287mg
0.2mg
0%
Threonine
1.05mg
0.452mg
0%
Isoleucine
1.183mg
0.813mg
0%
Leucine
1.908mg
1.56mg
0%
Lysine
2.166mg
1.857mg
0%
Methionine
0.629mg
0.552mg
0%
Phenylalanine
0.998mg
0.763mg
0%
Valine
1.323mg
0.847mg
0%
Histidine
0.777mg
0.68mg
0%
Omega-3 - DPA
0g
0.007g
N/A
Omega-6 - Eicosadienoic acid
0.01g
N/A
Macronutrient Comparison
Macronutrient breakdown side-by-side comparison
2
25%
21%
54%
Protein:
24.52 g
Fats:
20.94 g
Carbs:
0 g
Water:
53.72 g
Other:
0.82 g
3
19%
6%
2%
71%
3%
Protein:
18.56 g
Fats:
5.73 g
Carbs:
2.23 g
Water:
70.6 g
Other:
2.88 g
Contains
more
Protein Protein
+32.1%
Contains
more
Fats Fats
+265.4%
Contains
more
Carbs Carbs
+∞%
Contains
more
Water Water
+31.4%
Contains
more
Other Other
+251.2%
Fat Type Comparison
Fat type breakdown side-by-side comparison
2
46%
46%
8%
Saturated fat:
Sat. Fat
8.83 g
Monounsaturated fat:
Mono. Fat
8.82 g
Polyunsaturated fat:
Poly. Fat
1.51 g
1
32%
46%
22%
Saturated fat:
Sat. Fat
1.596 g
Monounsaturated fat:
Mono. Fat
2.333 g
Polyunsaturated fat:
Poly. Fat
1.089 g
Contains
more
Mono. Fat Monounsaturated fat
+278.1%
Contains
more
Poly. Fat Polyunsaturated fat
+38.7%
Contains
less
Sat. Fat Saturated fat
-81.9%