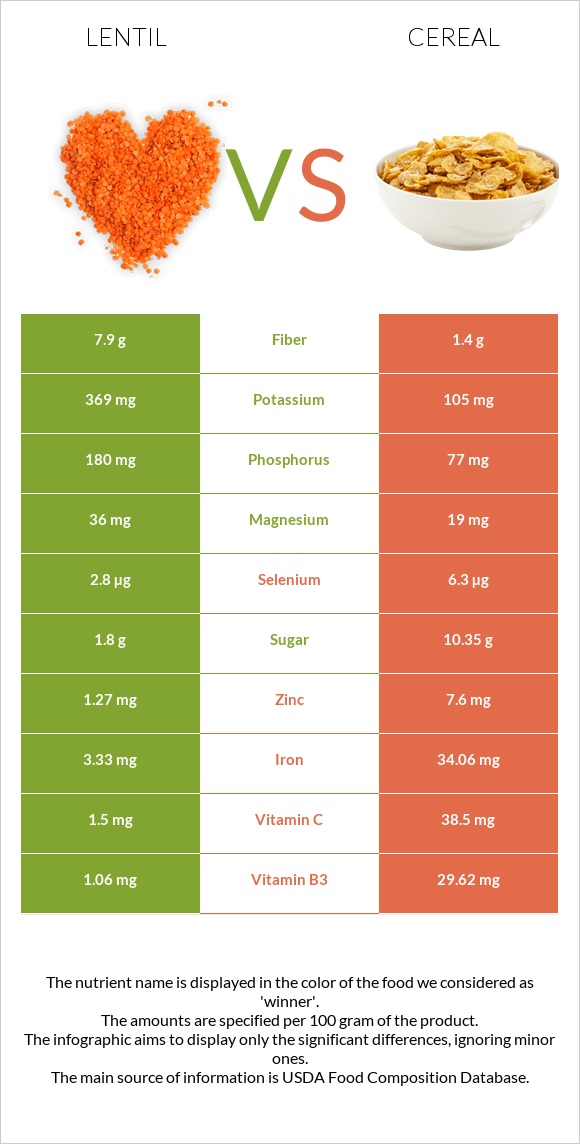
How are lentil and cereal different? Lentil is richer in fiber, while cereal is higher in vitamin B1, vitamin B6, iron, vitamin B2, vitamin B3, zinc, vitamin A, and vitamin C. Cereal covers your daily need for vitamin B1, 510% more than lentil. Lentil contains 6 times more fiber than cereal. Lentil contains 7.9g of fiber, while cereal contains 1.4g. Lentil is lower in sodium. Cereal has a higher glycemic index (69) than lentil (29). Lentils, mature seeds, cooked, boiled, without salt and Cereals ready-to-eat, USDA Commodity Corn and Rice (includes all commodity brands) types were used in this article.
Infographic
Mineral Comparison
Mineral comparison score is based on the number of minerals by which one or the other food is richer. The "coverage" charts below show how much of the daily needs can be covered by 300 grams of the food.
6
100 g
300 g
1 tbsp - 12.3g 1 cup - 198g
Magnesium
Magnesium
Calcium
Calcium
Potassium
Potassium
Iron
Iron
Copper
Copper
Zinc
Zinc
Phosphorus
Phosphorus
Sodium
Sodium
Manganese
Manganese
Selenium
Selenium
26%
5.7%
33%
125%
84%
35%
77%
0.26%
64%
15%
4
100 g
300 g
1 cup - 29g 1 serving (NLEA serving = 1 cup) - 29g
Magnesium
Magnesium
Calcium
Calcium
Potassium
Potassium
Iron
Iron
Copper
Copper
Zinc
Zinc
Phosphorus
Phosphorus
Sodium
Sodium
Manganese
Manganese
Selenium
Selenium
14%
3%
9.3%
1277%
46%
207%
33%
104%
103%
34%
Vitamin Comparison
Vitamin comparison score is based on the number of vitamins by which one or the other food is richer. The "coverage" charts below show how much of the daily needs can be covered by 300 grams of the food.
4
100 g
300 g
1 tbsp - 12.3g 1 cup - 198g
Vitamin C
Vit. C
Vitamin D
Vit. D
Vitamin A
Vit. A
Vitamin E
Vit. E
Vitamin B1
Vit. B1
Vitamin B2
Vit. B2
Vitamin B3
Vit. B3
Vitamin B5
Vit. B5
Vitamin B6
Vit. B6
Vitamin B12
Vit. B12
Vitamin K
Vit. K
Folate
Folate
5%
0%
0%
2.2%
42%
17%
20%
38%
41%
0%
4.3%
136%
6
100 g
300 g
1 cup - 29g 1 serving (NLEA serving = 1 cup) - 29g
Vitamin C
Vit. C
Vitamin D
Vit. D
Vitamin A
Vit. A
Vitamin E
Vit. E
Vitamin B1
Vit. B1
Vitamin B2
Vit. B2
Vitamin B3
Vit. B3
Vitamin B5
Vit. B5
Vitamin B6
Vit. B6
Vitamin B12
Vit. B12
Vitamin K
Vit. K
Folate
Folate
128%
0%
271%
1.6%
1572%
893%
555%
14%
1381%
0%
0%
0%
All nutrients comparison - raw data values
Nutrient
DV% diff.
Vitamin B1
0.169mg
6.288mg
510%
Vitamin B6
0.178mg
5.986mg
447%
Iron
3.33mg
34.06mg
384%
Vitamin B2
0.073mg
3.87mg
292%
Vitamin B3
1.06mg
29.62mg
179%
Vitamin A
0µg
814µg
90%
Zinc
1.27mg
7.6mg
58%
Folate
181µg
45%
Vitamin C
1.5mg
38.5mg
41%
Sodium
2mg
795mg
34%
Fiber
7.9g
1.4g
26%
Carbs
20.13g
86.85g
22%
Phosphorus
180mg
77mg
15%
Calories
116kcal
378kcal
13%
Copper
0.251mg
0.137mg
13%
Manganese
0.494mg
0.79mg
13%
Potassium
369mg
105mg
8%
Vitamin B5
0.638mg
0.226mg
8%
Protein
9.02g
6.06g
6%
Selenium
2.8µg
6.3µg
6%
Choline
32.7mg
6%
Magnesium
36mg
19mg
4%
Fats
0.38g
1.08g
1%
Calcium
19mg
10mg
1%
Vitamin K
1.7µg
0µg
1%
Saturated fat
0.053g
0.26g
1%
Polyunsaturated fat
0.175g
0.354g
1%
Protein per 100 calories
7.8g
1.6g
N/A
Calories per 10 g protein
129kcal
624kcal
N/A
Weight per 100 calories
86g
26g
N/A
Net carbs
12.23g
85.45g
N/A
Sugar
1.8g
10.35g
N/A
Vitamin E
0.11mg
0.08mg
0%
Monounsaturated fat
0.064g
0.204g
0%
Tryptophan
0.081mg
0.066mg
0%
Threonine
0.323mg
0.241mg
0%
Isoleucine
0.39mg
0.26mg
0%
Leucine
0.654mg
0.767mg
0%
Lysine
0.63mg
0.113mg
0%
Methionine
0.077mg
0.13mg
0%
Phenylalanine
0.445mg
0.365mg
0%
Valine
0.448mg
0.344mg
0%
Histidine
0.254mg
0.162mg
0%
Fructose
0.26g
0%
Macronutrient Comparison
Macronutrient breakdown side-by-side comparison
2
9%
20%
70%
Protein:
9.02 g
Fats:
0.38 g
Carbs:
20.13 g
Water:
69.64 g
Other:
0.83 g
3
6%
87%
4%
2%
Protein:
6.06 g
Fats:
1.08 g
Carbs:
86.85 g
Water:
3.78 g
Other:
2.23 g
Contains
more
Protein Protein
+48.8%
Contains
more
Water Water
+1742.3%
Contains
more
Fats Fats
+184.2%
Contains
more
Carbs Carbs
+331.4%
Contains
more
Other Other
+168.7%
Fat Type Comparison
Fat type breakdown side-by-side comparison
1
18%
22%
60%
Saturated fat:
Sat. Fat
0.053 g
Monounsaturated fat:
Mono. Fat
0.064 g
Polyunsaturated fat:
Poly. Fat
0.175 g
2
32%
25%
43%
Saturated fat:
Sat. Fat
0.26 g
Monounsaturated fat:
Mono. Fat
0.204 g
Polyunsaturated fat:
Poly. Fat
0.354 g
Contains
less
Sat. Fat Saturated fat
-79.6%
Contains
more
Mono. Fat Monounsaturated fat
+218.8%
Contains
more
Poly. Fat Polyunsaturated fat
+102.3%