McDonald's cheeseburger vs. McDonald's hamburger — In-Depth Nutrition Comparison
Compare
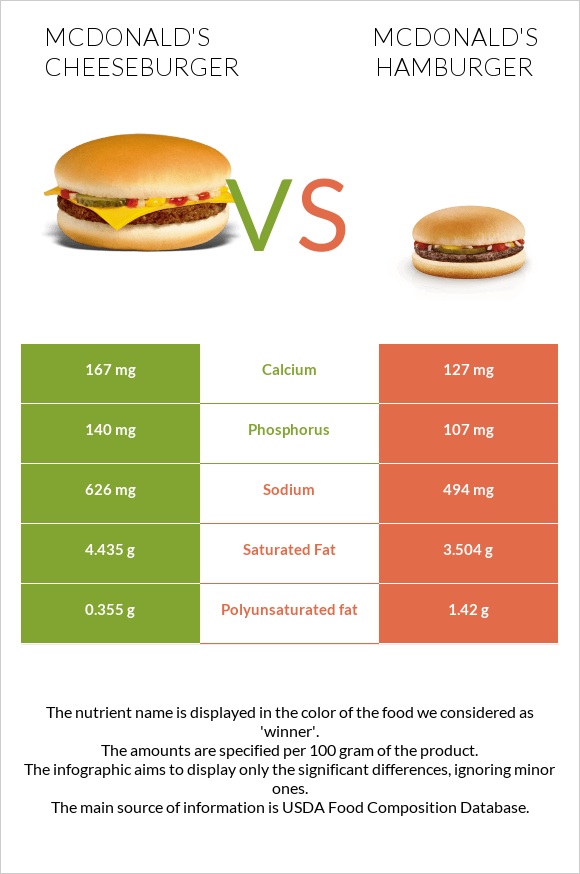
Differences between mcDonald's cheeseburgers and mcDonald's hamburgers
- McDonald's cheeseburgers contain less iron and polyunsaturated fat than mcDonald's hamburgers.
- The amount of sodium in mcDonald's hamburgers is lower.
The food types used in this comparison are McDONALD'S, Cheeseburger and McDONALD'S, Hamburger.
Infographic
Infographic link
Mineral Comparison
Mineral comparison score is based on the number of minerals by which one or the other food is richer. The "coverage" charts below show how much of the daily needs can be covered by 300 grams of the food.
| Contains more CalciumCalcium | +31.5% |
| Contains more PhosphorusPhosphorus | +30.8% |
| Contains more IronIron | +22.1% |
| Contains less SodiumSodium | -21.1% |
| Contains more ManganeseManganese | +40% |
Vitamin Comparison
Vitamin comparison score is based on the number of vitamins by which one or the other food is richer. The "coverage" charts below show how much of the daily needs can be covered by 300 grams of the food.
| Contains more Vitamin B1Vitamin B1 | +10.8% |
| Contains more Vitamin B3Vitamin B3 | +12.9% |
All nutrients comparison - raw data values
| Nutrient |  |
 |
DV% diff. |
| Selenium | 26.2µg | 48% | |
| Iron | 2.35mg | 2.87mg | 7% |
| Polyunsaturated fat | 0.355g | 1.42g | 7% |
| Sodium | 626mg | 494mg | 6% |
| Phosphorus | 140mg | 107mg | 5% |
| Calcium | 167mg | 127mg | 4% |
| Manganese | 0.23mg | 0.322mg | 4% |
| Saturated fat | 4.435g | 3.504g | 4% |
| Fats | 11.79g | 10.09g | 3% |
| Cholesterol | 35mg | 27mg | 3% |
| Vitamin B3 | 4.026mg | 4.544mg | 3% |
| Vitamin B1 | 0.223mg | 0.247mg | 2% |
| Vitamin B2 | 0.26mg | 0.239mg | 2% |
| Carbs | 27.81g | 30.28g | 1% |
| Fiber | 1.1g | 1.3g | 1% |
| Vitamin B12 | 0.86µg | 0.83µg | 1% |
| Folate | 59µg | 64µg | 1% |
| Fructose | 2.59g | 3.3g | 1% |
| Calories | 263kcal | 264kcal | 0% |
| Protein | 12.97g | 12.92g | 0% |
| Protein per 100 calories | 4.9g | 4.9g | N/A |
| Calories per 10 g protein | 203kcal | 204kcal | N/A |
| Weight per 100 calories | 38g | 38g | N/A |
| Unsaturated / Saturated Fat ratio | 0.9 | 1.5 | N/A |
| Vitamin C | 0.6mg | 0.6mg | 0% |
| Net carbs | 26.71g | 28.98g | N/A |
| Magnesium | 20mg | 21mg | 0% |
| Potassium | 200mg | 192mg | 0% |
| Sugar | 6.22g | 6.03g | N/A |
| Copper | 0.097mg | 0.096mg | 0% |
| Zinc | 1.91mg | 1.95mg | 0% |
| Trans fat | 0.647g | 0.428g | N/A |
| Monounsaturated fat | 3.631g | 3.768g | 0% |
| Omega-3 - EPA | 0.002g | N/A | |
| Omega-3 - ALA | 0.134g | N/A | |
| Omega-3 - DPA | 0.006g | N/A | |
| Omega-3 - Eicosatrienoic acid | 0.001g | N/A | |
| Omega-6 - Gamma-linoleic acid | 0.004g | N/A | |
| Omega-6 - Dihomo-gamma-linoleic acid | 0.011g | N/A | |
| Omega-6 - Eicosadienoic acid | 0.004g | N/A | |
| Omega-6 - Linoleic acid | 1.135g | N/A |
Macronutrient Comparison
Macronutrient breakdown side-by-side comparison
Protein:
12.97 g
Fats:
11.79 g
Carbs:
27.81 g
Water:
45 g
Other:
2.43 g
Protein:
12.92 g
Fats:
10.09 g
Carbs:
30.28 g
Water:
44.53 g
Other:
2.18 g
| Contains more FatsFats | +16.8% |
| Contains more OtherOther | +11.5% |
~equal in
Protein
~12.92g
~equal in
Carbs
~30.28g
~equal in
Water
~44.53g
Fat Type Comparison
Fat type breakdown side-by-side comparison
Saturated fat:
Sat. Fat
4.435 g
Monounsaturated fat:
Mono. Fat
3.631 g
Polyunsaturated fat:
Poly. Fat
0.355 g
Saturated fat:
Sat. Fat
3.504 g
Monounsaturated fat:
Mono. Fat
3.768 g
Polyunsaturated fat:
Poly. Fat
1.42 g
| Contains less Sat. FatSaturated fat | -21% |
| Contains more Poly. FatPolyunsaturated fat | +300% |
~equal in
Monounsaturated fat
~3.768g
Carbohydrate type comparison
Carbohydrate type breakdown side-by-side comparison
Starch:
0 g
Sucrose:
0.24 g
Glucose:
2.01 g
Fructose:
2.59 g
Lactose:
0.54 g
Maltose:
0.84 g
Galactose:
0 g
Starch:
0 g
Sucrose:
0 g
Glucose:
2.1 g
Fructose:
3.3 g
Lactose:
0 g
Maltose:
0.63 g
Galactose:
0 g
| Contains more SucroseSucrose | +∞% |
| Contains more LactoseLactose | +∞% |
| Contains more MaltoseMaltose | +33.3% |
| Contains more FructoseFructose | +27.4% |
~equal in
Starch
~0g
~equal in
Glucose
~2.1g
~equal in
Galactose
~0g


