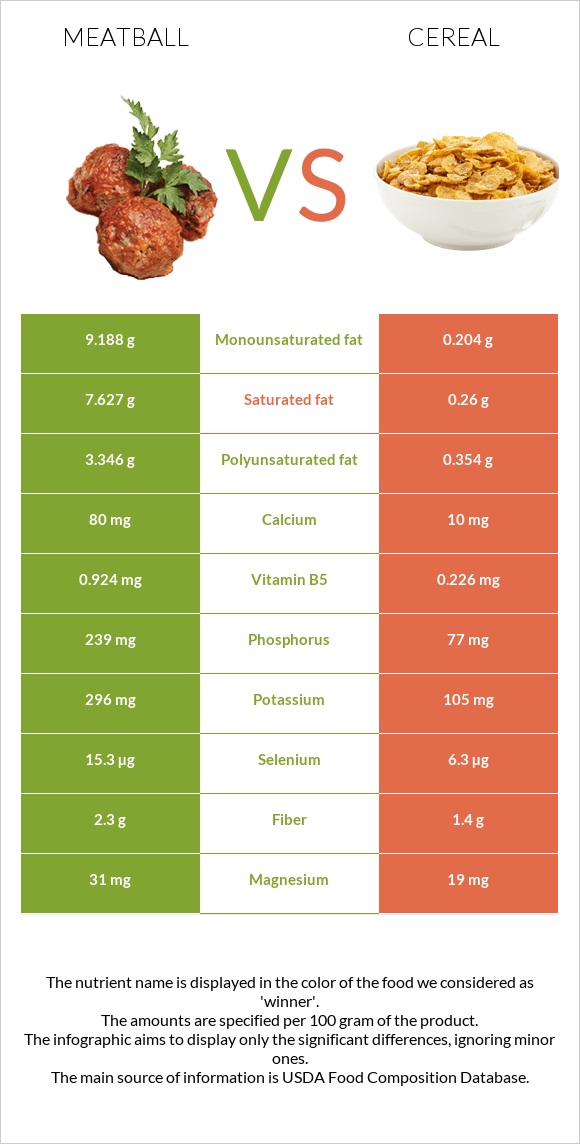
Significant differences between meatball and cereal Meatball has more phosphorus; however, cereal is richer in vitamin B1, vitamin B6, iron, vitamin B2, vitamin B3, vitamin A, zinc, and vitamin C. Cereal covers your daily vitamin B1 needs 513% more than meatball. Cereal has 29 times less saturated fat than meatball. Meatball has 7.627g of saturated fat, while cereal has 0.26g. Cereal has a higher glycemic index. The glycemic index of cereal is 69, while the glycemic index of meatball is 0. Specific food types used in this comparison are Meatballs, frozen, Italian style and Cereals ready-to-eat, USDA Commodity Corn and Rice (includes all commodity brands) .
Infographic
Mineral Comparison
Mineral comparison score is based on the number of minerals by which one or the other food is richer. The "coverage" charts below show how much of the daily needs can be covered by 300 grams of the food.
6
100 g
300 g
3 pieces - 56g 3 oz - 85g
Magnesium
Magnesium
Calcium
Calcium
Potassium
Potassium
Iron
Iron
Copper
Copper
Zinc
Zinc
Phosphorus
Phosphorus
Sodium
Sodium
Manganese
Manganese
Selenium
Selenium
22%
24%
26%
66%
41%
45%
102%
87%
37%
83%
4
100 g
300 g
1 cup - 29g 1 serving (NLEA serving = 1 cup) - 29g
Magnesium
Magnesium
Calcium
Calcium
Potassium
Potassium
Iron
Iron
Copper
Copper
Zinc
Zinc
Phosphorus
Phosphorus
Sodium
Sodium
Manganese
Manganese
Selenium
Selenium
14%
3%
9.3%
1277%
46%
207%
33%
104%
103%
34%
Vitamin Comparison
Vitamin comparison score is based on the number of vitamins by which one or the other food is richer. The "coverage" charts below show how much of the daily needs can be covered by 300 grams of the food.
6
100 g
300 g
3 pieces - 56g 3 oz - 85g
Vitamin C
Vit. C
Vitamin D
Vit. D
Vitamin A
Vit. A
Vitamin E
Vit. E
Vitamin B1
Vit. B1
Vitamin B2
Vit. B2
Vitamin B3
Vit. B3
Vitamin B5
Vit. B5
Vitamin B6
Vit. B6
Vitamin B12
Vit. B12
Vitamin K
Vit. K
Folate
Folate
0%
1.5%
7.3%
8.4%
34%
53%
58%
55%
47%
125%
21%
27%
6
100 g
300 g
1 cup - 29g 1 serving (NLEA serving = 1 cup) - 29g
Vitamin C
Vit. C
Vitamin D
Vit. D
Vitamin A
Vit. A
Vitamin E
Vit. E
Vitamin B1
Vit. B1
Vitamin B2
Vit. B2
Vitamin B3
Vit. B3
Vitamin B5
Vit. B5
Vitamin B6
Vit. B6
Vitamin B12
Vit. B12
Vitamin K
Vit. K
Folate
Folate
128%
0%
271%
1.6%
1572%
893%
555%
14%
1381%
0%
0%
0%
All nutrients comparison - raw data values
Nutrient
DV% diff.
Vitamin B1
0.136mg
6.288mg
513%
Vitamin B6
0.202mg
5.986mg
445%
Iron
1.77mg
34.06mg
404%
Vitamin B2
0.23mg
3.87mg
280%
Vitamin B3
3.108mg
29.62mg
166%
Vitamin A
22µg
814µg
88%
Zinc
1.66mg
7.6mg
54%
Vitamin C
0mg
38.5mg
43%
Vitamin B12
1µg
42%
Fats
22.21g
1.08g
33%
Saturated fat
7.627g
0.26g
33%
Carbs
8.06g
86.85g
26%
Phosphorus
239mg
77mg
23%
Cholesterol
66mg
22%
Manganese
0.282mg
0.79mg
22%
Monounsaturated fat
9.188g
0.204g
22%
Polyunsaturated fat
3.346g
0.354g
20%
Protein
14.4g
6.06g
17%
Selenium
15.3µg
6.3µg
16%
Vitamin B5
0.924mg
0.226mg
14%
Folate
36µg
9%
Choline
45.2mg
8%
Calcium
80mg
10mg
7%
Vitamin K
8.2µg
0µg
7%
Potassium
296mg
105mg
6%
Sodium
666mg
795mg
6%
Calories
286kcal
378kcal
5%
Fiber
2.3g
1.4g
4%
Magnesium
31mg
19mg
3%
Copper
0.123mg
0.137mg
2%
Vitamin E
0.42mg
0.08mg
2%
Vitamin D
0.1µg
1%
Starch
2.25g
1%
Protein per 100 calories
5g
1.6g
N/A
Calories per 10 g protein
199kcal
624kcal
N/A
Weight per 100 calories
35g
26g
N/A
Unsaturated / Saturated Fat ratio
1.6
2.1
N/A
Net carbs
5.76g
85.45g
N/A
Vitamin D*
2 IU
0%
Sugar
3.47g
10.35g
N/A
Trans fat
0.577g
N/A
Tryptophan
0.066mg
0%
Threonine
0.241mg
0%
Isoleucine
0.26mg
0%
Leucine
0.767mg
0%
Lysine
0.113mg
0%
Methionine
0.13mg
0%
Phenylalanine
0.365mg
0%
Valine
0.344mg
0%
Histidine
0.162mg
0%
Fructose
0.21g
0.26g
0%
Omega-3 - EPA
0.005g
0g
N/A
Omega-3 - DHA
0.004g
0g
N/A
Omega-3 - ALA
0.163g
N/A
Omega-3 - DPA
0.013g
0g
N/A
Omega-3 - Eicosatrienoic acid
0.012g
N/A
Omega-6 - Gamma-linoleic acid
0.005g
N/A
Omega-6 - Dihomo-gamma-linoleic acid
0.022g
N/A
Omega-6 - Eicosadienoic acid
0.07g
0g
N/A
Omega-6 - Linoleic acid
2.815g
N/A
Macronutrient Comparison
Macronutrient breakdown side-by-side comparison
3
14%
22%
8%
54%
Protein:
14.4 g
Fats:
22.21 g
Carbs:
8.06 g
Water:
53.67 g
Other:
1.66 g
2
6%
87%
4%
2%
Protein:
6.06 g
Fats:
1.08 g
Carbs:
86.85 g
Water:
3.78 g
Other:
2.23 g
Contains
more
Protein Protein
+137.6%
Contains
more
Fats Fats
+1956.5%
Contains
more
Water Water
+1319.8%
Contains
more
Carbs Carbs
+977.5%
Contains
more
Other Other
+34.3%
Fat Type Comparison
Fat type breakdown side-by-side comparison
2
38%
46%
17%
Saturated fat:
Sat. Fat
7.627 g
Monounsaturated fat:
Mono. Fat
9.188 g
Polyunsaturated fat:
Poly. Fat
3.346 g
1
32%
25%
43%
Saturated fat:
Sat. Fat
0.26 g
Monounsaturated fat:
Mono. Fat
0.204 g
Polyunsaturated fat:
Poly. Fat
0.354 g
Contains
more
Mono. Fat Monounsaturated fat
+4403.9%
Contains
more
Poly. Fat Polyunsaturated fat
+845.2%
Contains
less
Sat. Fat Saturated fat
-96.6%
Carbohydrate type comparison
Carbohydrate type breakdown side-by-side comparison
5
39%
8%
28%
4%
15%
5%
Starch:
2.25 g
Sucrose:
0.48 g
Glucose:
1.61 g
Fructose:
0.21 g
Lactose:
0.87 g
Maltose:
0.27 g
Galactose:
0.04 g
2
94%
3%
3%
Starch:
0 g
Sucrose:
9.74 g
Glucose:
0.27 g
Fructose:
0.26 g
Lactose:
0 g
Maltose:
0.09 g
Galactose:
0 g
Contains
more
Starch Starch
+∞%
Contains
more
Glucose Glucose
+496.3%
Contains
more
Lactose Lactose
+∞%
Contains
more
Maltose Maltose
+200%
Contains
more
Galactose Galactose
+∞%
Contains
more
Sucrose Sucrose
+1929.2%
Contains
more
Fructose Fructose
+23.8%