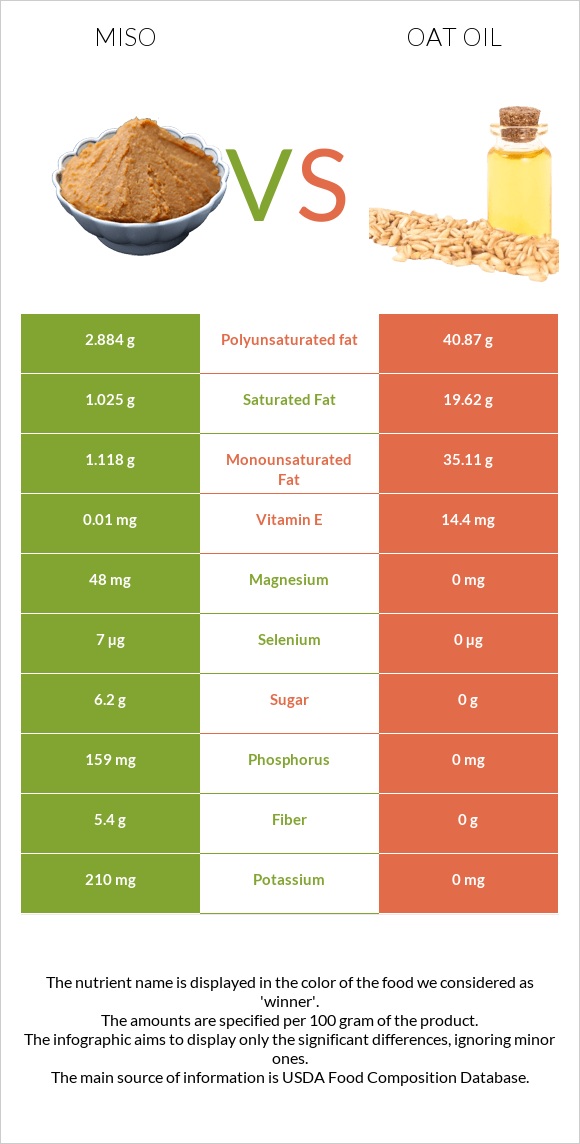
Significant differences between miso and oat oil Miso has more copper, manganese, iron, zinc, phosphorus, fiber, and vitamin B2; however, oat oil is richer in vitamin E. Miso covers your daily sodium needs 162% more than oat oil. Oat oil contains less sodium. Specific food types used in this comparison are Miso and Oil, oat .
Infographic
Mineral Comparison
Mineral comparison score is based on the number of minerals by which one or the other food is richer. The "coverage" charts below show how much of the daily needs can be covered by 300 grams of the food.
9
100 g
300 g
1 tbsp - 17g 1 cup - 275g
Magnesium
Magnesium
Calcium
Calcium
Potassium
Potassium
Iron
Iron
Copper
Copper
Zinc
Zinc
Phosphorus
Phosphorus
Sodium
Sodium
Manganese
Manganese
Selenium
Selenium
34%
17%
19%
93%
140%
70%
68%
486%
112%
38%
1
100 g
300 g
1 tsp - 4.5g 1 tbsp - 13.6g 1 cup - 218g
Magnesium
Magnesium
Calcium
Calcium
Potassium
Potassium
Iron
Iron
Copper
Copper
Zinc
Zinc
Phosphorus
Phosphorus
Sodium
Sodium
Manganese
Manganese
Selenium
Selenium
0%
0%
0%
0%
0%
0%
0%
0%
0%
0%
Vitamin Comparison
Vitamin comparison score is based on the number of vitamins by which one or the other food is richer. The "coverage" charts below show how much of the daily needs can be covered by 300 grams of the food.
9
100 g
300 g
1 tbsp - 17g 1 cup - 275g
Vitamin C
Vit. C
Vitamin D
Vit. D
Vitamin A
Vit. A
Vitamin E
Vit. E
Vitamin B1
Vit. B1
Vitamin B2
Vit. B2
Vitamin B3
Vit. B3
Vitamin B5
Vit. B5
Vitamin B6
Vit. B6
Vitamin B12
Vit. B12
Vitamin K
Vit. K
Folate
Folate
0%
0%
1.3%
0.2%
25%
54%
17%
20%
46%
10%
73%
14%
1
100 g
300 g
1 tsp - 4.5g 1 tbsp - 13.6g 1 cup - 218g
Vitamin C
Vit. C
Vitamin D
Vit. D
Vitamin A
Vit. A
Vitamin E
Vit. E
Vitamin B1
Vit. B1
Vitamin B2
Vit. B2
Vitamin B3
Vit. B3
Vitamin B5
Vit. B5
Vitamin B6
Vit. B6
Vitamin B12
Vit. B12
Vitamin K
Vit. K
Folate
Folate
0%
0%
0%
288%
0%
0%
0%
0%
0%
0%
62%
0%
All nutrients comparison - raw data values
Nutrient
DV% diff.
Polyunsaturated fat
2.884g
40.87g
253%
Sodium
3728mg
0mg
162%
Fats
6.01g
100g
145%
Vitamin E
0.01mg
14.4mg
96%
Saturated fat
1.025g
19.62g
85%
Monounsaturated fat
1.118g
35.11g
85%
Copper
0.42mg
0mg
47%
Manganese
0.859mg
0mg
37%
Calories
198kcal
884kcal
34%
Iron
2.49mg
0mg
31%
Protein
12.79g
0g
26%
Zinc
2.56mg
0mg
23%
Phosphorus
159mg
0mg
23%
Fiber
5.4g
0g
22%
Vitamin B2
0.233mg
0mg
18%
Vitamin B6
0.199mg
0mg
15%
Selenium
7µg
0µg
13%
Choline
72.2mg
13%
Magnesium
48mg
0mg
11%
Carbs
25.37g
0g
8%
Vitamin B1
0.098mg
0mg
8%
Fructose
6g
8%
Vitamin B5
0.337mg
0mg
7%
Calcium
57mg
0mg
6%
Potassium
210mg
0mg
6%
Vitamin B3
0.906mg
0mg
6%
Folate
19µg
0µg
5%
Vitamin K
29.3µg
24.7µg
4%
Vitamin B12
0.08µg
0µg
3%
Protein per 100 calories
6.5g
0g
N/A
Calories per 10 g protein
155kcal
N/A
Weight per 100 calories
51g
11g
N/A
Unsaturated / Saturated Fat ratio
3.9
3.9
N/A
Net carbs
19.97g
0g
N/A
Sugar
6.2g
0g
N/A
Vitamin A
4µg
0µg
0%
Tryptophan
0.155mg
0%
Threonine
0.479mg
0%
Isoleucine
0.508mg
0%
Leucine
0.82mg
0%
Lysine
0.478mg
0%
Methionine
0.129mg
0%
Phenylalanine
0.486mg
0%
Valine
0.547mg
0%
Histidine
0.243mg
0%
Macronutrient Comparison
Macronutrient breakdown side-by-side comparison
4
13%
6%
25%
43%
13%
Protein:
12.79 g
Fats:
6.01 g
Carbs:
25.37 g
Water:
43.02 g
Other:
12.81 g
1
100%
Protein:
0 g
Fats:
100 g
Carbs:
0 g
Water:
0 g
Other:
0 g
Contains
more
Protein Protein
+∞%
Contains
more
Carbs Carbs
+∞%
Contains
more
Water Water
+∞%
Contains
more
Other Other
+∞%
Contains
more
Fats Fats
+1563.9%
Fat Type Comparison
Fat type breakdown side-by-side comparison
1
20%
22%
57%
Saturated fat:
Sat. Fat
1.025 g
Monounsaturated fat:
Mono. Fat
1.118 g
Polyunsaturated fat:
Poly. Fat
2.884 g
2
21%
37%
43%
Saturated fat:
Sat. Fat
19.62 g
Monounsaturated fat:
Mono. Fat
35.11 g
Polyunsaturated fat:
Poly. Fat
40.87 g
Contains
less
Sat. Fat Saturated fat
-94.8%
Contains
more
Mono. Fat Monounsaturated fat
+3040.4%
Contains
more
Poly. Fat Polyunsaturated fat
+1317.1%