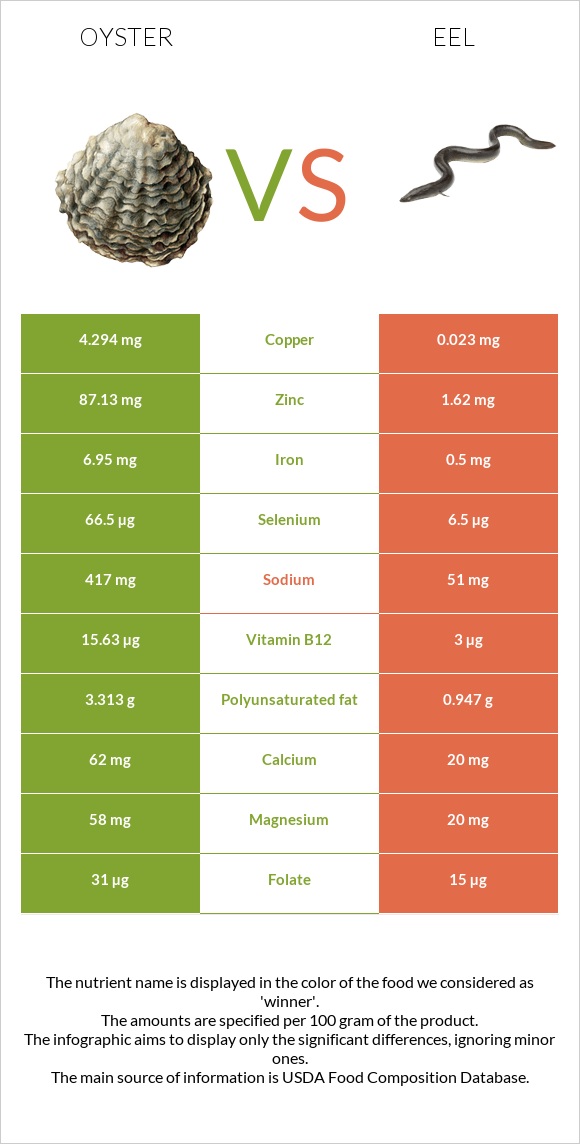
A recap on the differences between oysters and eels Oysters is higher in zinc, copper, vitamin B12, iron, selenium, and manganese, yet eels are higher in vitamin A, vitamin B3, and vitamin B1. Oysters covers your daily zinc needs 696% more than eels. Oysters contains 197 times more copper than eels. While oysters contains 5.707mg of copper, eels contain only 0.029mg. The amount of cholesterol in oysters is lower. Food varieties used in this article are Mollusks, oyster, eastern, wild, cooked, moist heat and Fish, eel, mixed species, cooked, dry heat .
Infographic
Mineral Comparison
Mineral comparison score is based on the number of minerals by which one or the other food is richer. The "coverage" charts below show how much of the daily needs can be covered by 300 grams of the food.
7
100 g
300 g
6 medium - 42g 3 oz - 85g
Magnesium
Magnesium
Calcium
Calcium
Potassium
Potassium
Iron
Iron
Copper
Copper
Zinc
Zinc
Phosphorus
Phosphorus
Sodium
Sodium
Manganese
Manganese
Selenium
Selenium
25%
35%
12%
345%
1902%
2144%
83%
22%
77%
215%
3
100 g
300 g
1 cubic inch, boneless - 17g 1 oz with bone (yield after bone removed) - 22g 1 oz, boneless - 28.35g 3 oz - 85g 1 fillet - 159g
Magnesium
Magnesium
Calcium
Calcium
Potassium
Potassium
Iron
Iron
Copper
Copper
Zinc
Zinc
Phosphorus
Phosphorus
Sodium
Sodium
Manganese
Manganese
Selenium
Selenium
19%
7.8%
31%
24%
9.7%
57%
119%
8.5%
5.2%
45%
Vitamin Comparison
Vitamin comparison score is based on the number of vitamins by which one or the other food is richer. The "coverage" charts below show how much of the daily needs can be covered by 300 grams of the food.
5
100 g
300 g
6 medium - 42g 3 oz - 85g
Vitamin C
Vit. C
Vitamin D
Vit. D
Vitamin A
Vit. A
Vitamin E
Vit. E
Vitamin B1
Vit. B1
Vitamin B2
Vit. B2
Vitamin B3
Vit. B3
Vitamin B5
Vit. B5
Vitamin B6
Vit. B6
Vitamin B12
Vit. B12
Vitamin K
Vit. K
Folate
Folate
0%
0%
8.7%
34%
9%
42%
35%
27%
14%
2188%
5%
11%
6
100 g
300 g
1 cubic inch, boneless - 17g 1 oz with bone (yield after bone removed) - 22g 1 oz, boneless - 28.35g 3 oz - 85g 1 fillet - 159g
Vitamin C
Vit. C
Vitamin D
Vit. D
Vitamin A
Vit. A
Vitamin E
Vit. E
Vitamin B1
Vit. B1
Vitamin B2
Vit. B2
Vitamin B3
Vit. B3
Vitamin B5
Vit. B5
Vitamin B6
Vit. B6
Vitamin B12
Vit. B12
Vitamin K
Vit. K
Folate
Folate
6%
0%
379%
0%
46%
12%
84%
17%
18%
361%
0%
13%
All nutrients comparison - raw data values
Nutrient
DV% diff.
Zinc
78.6mg
2.08mg
696%
Copper
5.707mg
0.029mg
631%
Vitamin B12
17.5µg
2.89µg
609%
Vitamin A
26µg
1137µg
123%
Iron
9.21mg
0.64mg
107%
Selenium
39.5µg
8.3µg
57%
Cholesterol
79mg
161mg
27%
Protein
11.42g
23.65g
24%
Manganese
0.591mg
0.04mg
24%
Choline
130mg
24%
Monounsaturated fat
0.506g
9.218g
22%
Fats
3.42g
14.95g
18%
Vitamin B3
1.85mg
4.487mg
16%
Phosphorus
194mg
277mg
12%
Vitamin B1
0.036mg
0.183mg
12%
Vitamin E
1.7mg
11%
Vitamin B2
0.18mg
0.051mg
10%
Calcium
116mg
26mg
9%
Saturated fat
0.948g
3.023g
9%
Calories
102kcal
236kcal
7%
Potassium
139mg
349mg
6%
Sodium
166mg
65mg
4%
Vitamin B5
0.447mg
0.28mg
3%
Vitamin C
0mg
1.8mg
2%
Carbs
5.45g
0g
2%
Magnesium
35mg
26mg
2%
Vitamin K
2µg
2%
Vitamin B6
0.061mg
0.077mg
1%
Folate
14µg
17µg
1%
Polyunsaturated fat
1.056g
1.214g
1%
Protein per 100 calories
11g
10g
N/A
Calories per 10 g protein
89kcal
100kcal
N/A
Weight per 100 calories
98g
42g
N/A
Unsaturated / Saturated Fat ratio
1.6
3.5
N/A
Net carbs
5.45g
0g
N/A
Vitamin D*
2 IU
0%
Sugar
1.23g
N/A
Starch
0.9g
0%
Trans fat
0.068g
N/A
Tryptophan
0.138mg
0.265mg
0%
Threonine
0.046mg
1.037mg
0%
Isoleucine
0.459mg
1.09mg
0%
Leucine
0.716mg
1.922mg
0%
Lysine
0.762mg
2.171mg
0%
Methionine
0.257mg
0.7mg
0%
Phenylalanine
0.413mg
0.923mg
0%
Valine
0.523mg
1.218mg
0%
Histidine
0.22mg
0.696mg
0%
Omega-3 - EPA
0.353g
0.108g
N/A
Omega-3 - DHA
0.271g
0.081g
N/A
Omega-3 - ALA
0.163g
N/A
Omega-3 - DPA
0.02g
0.095g
N/A
Omega-3 - Eicosatrienoic acid
0.004g
N/A
Omega-6 - Gamma-linoleic acid
0.004g
N/A
Omega-6 - Dihomo-gamma-linoleic acid
0.007g
N/A
Omega-6 - Eicosadienoic acid
0.007g
N/A
Omega-6 - Linoleic acid
0.061g
N/A
Macronutrient Comparison
Macronutrient breakdown side-by-side comparison
2
11%
3%
5%
78%
Protein:
11.42 g
Fats:
3.42 g
Carbs:
5.45 g
Water:
78.19 g
Other:
1.52 g
3
24%
15%
59%
2%
Protein:
23.65 g
Fats:
14.95 g
Carbs:
0 g
Water:
59.31 g
Other:
2.09 g
Contains
more
Carbs Carbs
+∞%
Contains
more
Water Water
+31.8%
Contains
more
Protein Protein
+107.1%
Contains
more
Fats Fats
+337.1%
Contains
more
Other Other
+37.5%
Fat Type Comparison
Fat type breakdown side-by-side comparison
1
38%
20%
42%
Saturated fat:
Sat. Fat
0.948 g
Monounsaturated fat:
Mono. Fat
0.506 g
Polyunsaturated fat:
Poly. Fat
1.056 g
2
22%
69%
9%
Saturated fat:
Sat. Fat
3.023 g
Monounsaturated fat:
Mono. Fat
9.218 g
Polyunsaturated fat:
Poly. Fat
1.214 g
Contains
less
Sat. Fat Saturated fat
-68.6%
Contains
more
Mono. Fat Monounsaturated fat
+1721.7%
Contains
more
Poly. Fat Polyunsaturated fat
+15%