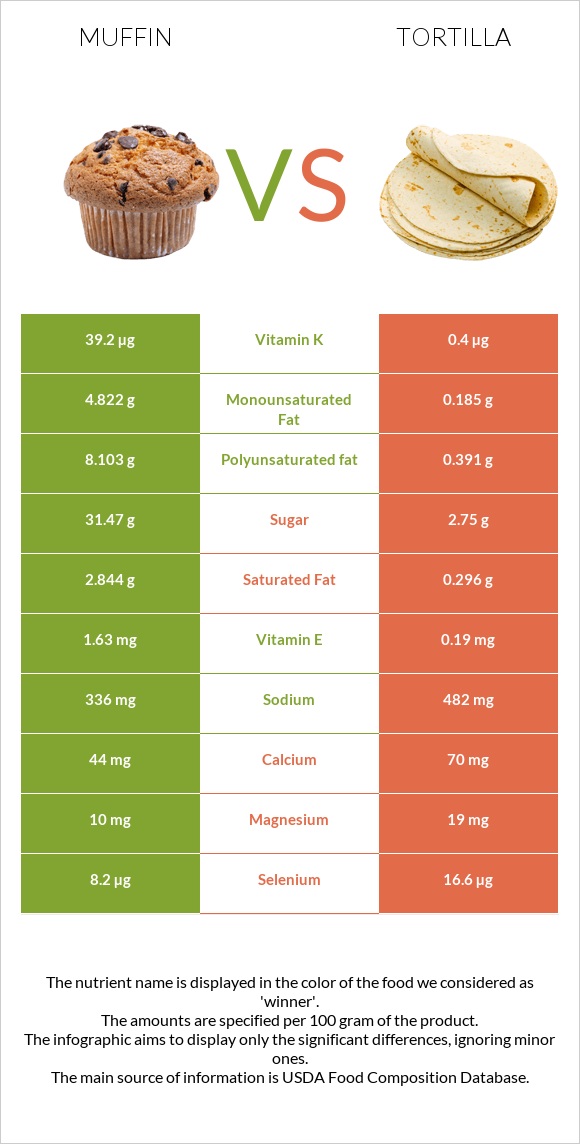
How are muffin and tortillas different? Muffin is higher in vitamin K; however, tortillas are richer in vitamin B1, selenium, fiber, phosphorus, copper, folate, vitamin B3, vitamin B6, and calcium. Daily need coverage for vitamin B1 for tortillas is 55% higher. Muffin contains 9 times more vitamin K than tortillas. While muffin contains 39.2µg of vitamin K, tortillas contain only 4.5µg. Muffins, blueberry, commercially prepared (Includes mini-muffins) and Tortillas, ready-to-bake or -fry, whole wheat are the varieties used in this article.
Infographic
Mineral Comparison
Mineral comparison score is based on the number of minerals by which one or the other food is richer. The "coverage" charts below show how much of the daily needs can be covered by 300 grams of the food.
2
100 g
300 g
1 mini (1-1/4" dia) - 17g 1 oz - 28.35g 1 muffin - 31g 1 small (2-3/4" dia x 2") - 66g 1 medium - 113g 1 large (3-1/4" dia x 2-3/4") - 139g 1 extra large - 168g
Magnesium
Magnesium
Calcium
Calcium
Potassium
Potassium
Iron
Iron
Copper
Copper
Zinc
Zinc
Phosphorus
Phosphorus
Sodium
Sodium
Manganese
Manganese
Selenium
Selenium
7.1%
13%
11%
49%
20%
10%
63%
44%
59%
45%
8
100 g
300 g
1 tortilla 1 serving - 41g
Magnesium
Magnesium
Calcium
Calcium
Potassium
Potassium
Iron
Iron
Copper
Copper
Zinc
Zinc
Phosphorus
Phosphorus
Sodium
Sodium
Manganese
Manganese
Selenium
Selenium
61%
73%
23%
99%
89%
52%
148%
67%
0%
202%
Vitamin Comparison
Vitamin comparison score is based on the number of vitamins by which one or the other food is richer. The "coverage" charts below show how much of the daily needs can be covered by 300 grams of the food.
7
100 g
300 g
1 mini (1-1/4" dia) - 17g 1 oz - 28.35g 1 muffin - 31g 1 small (2-3/4" dia x 2") - 66g 1 medium - 113g 1 large (3-1/4" dia x 2-3/4") - 139g 1 extra large - 168g
Vitamin C
Vit. C
Vitamin D
Vit. D
Vitamin A
Vit. A
Vitamin E
Vit. E
Vitamin B1
Vit. B1
Vitamin B2
Vit. B2
Vitamin B3
Vit. B3
Vitamin B5
Vit. B5
Vitamin B6
Vit. B6
Vitamin B12
Vit. B12
Vitamin K
Vit. K
Folate
Folate
3%
1.5%
7%
33%
42%
38%
27%
28%
9.2%
20%
98%
36%
5
100 g
300 g
1 tortilla 1 serving - 41g
Vitamin C
Vit. C
Vitamin D
Vit. D
Vitamin A
Vit. A
Vitamin E
Vit. E
Vitamin B1
Vit. B1
Vitamin B2
Vit. B2
Vitamin B3
Vit. B3
Vitamin B5
Vit. B5
Vitamin B6
Vit. B6
Vitamin B12
Vit. B12
Vitamin K
Vit. K
Folate
Folate
0%
0%
0%
18%
206%
67%
91%
0%
72%
0%
11%
104%
All nutrients comparison - raw data values
Nutrient
DV% diff.
Vitamin B1
0.168mg
0.823mg
55%
Selenium
8.2µg
37µg
52%
Polyunsaturated fat
8.103g
0.992g
47%
Fiber
1.1g
9.8g
35%
Phosphorus
146mg
346mg
29%
Vitamin K
39.2µg
4.5µg
29%
Copper
0.06mg
0.266mg
23%
Folate
48µg
138µg
23%
Vitamin B3
1.418mg
4.858mg
22%
Vitamin B6
0.04mg
0.312mg
21%
Calcium
44mg
244mg
20%
Manganese
0.449mg
20%
Magnesium
10mg
85mg
18%
Iron
1.3mg
2.63mg
17%
Zinc
0.37mg
1.92mg
14%
Choline
92.5mg
20mg
13%
Protein
4.49g
9.76g
11%
Fats
16.07g
9.76g
10%
Cholesterol
30mg
0mg
10%
Vitamin B2
0.163mg
0.289mg
10%
Vitamin B5
0.47mg
9%
Saturated fat
2.844g
4.878g
9%
Sodium
336mg
512mg
8%
Starch
16.31g
7%
Vitamin B12
0.16µg
0µg
7%
Vitamin E
1.63mg
0.9mg
5%
Potassium
121mg
262mg
4%
Monounsaturated fat
4.822g
3.062g
4%
Calories
375kcal
310kcal
3%
Carbs
53g
45.89g
2%
Vitamin A
21µg
0µg
2%
Fructose
1.21g
2%
Vitamin C
0.9mg
0mg
1%
Vitamin D*
4 IU
0 IU
1%
Vitamin D
0.1µg
0µg
1%
Protein per 100 calories
1.2g
3.1g
N/A
Calories per 10 g protein
835kcal
318kcal
N/A
Weight per 100 calories
27g
32g
N/A
Unsaturated / Saturated Fat ratio
4.5
0.83
N/A
Net carbs
51.9g
36.09g
N/A
Sugar
31.47g
2.44g
N/A
Trans fat
0.2g
0g
N/A
Tryptophan
0.066mg
0.129mg
0%
Threonine
0.181mg
0.312mg
0%
Isoleucine
0.224mg
0.353mg
0%
Leucine
0.421mg
0.671mg
0%
Lysine
0.199mg
0.37mg
0%
Methionine
0.115mg
0.163mg
0%
Phenylalanine
0.277mg
0.488mg
0%
Valine
0.257mg
0.444mg
0%
Histidine
0.128mg
0.255mg
0%
Omega-3 - DHA
0.008g
0g
N/A
Omega-3 - ALA
1.022g
N/A
Omega-3 - DPA
0.001g
0g
N/A
Omega-6 - Gamma-linoleic acid
0.048g
N/A
Omega-6 - Dihomo-gamma-linoleic acid
0.002g
N/A
Omega-6 - Eicosadienoic acid
0.007g
0g
N/A
Omega-6 - Linoleic acid
6.911g
N/A
Macronutrient Comparison
Macronutrient breakdown side-by-side comparison
2
4%
16%
53%
25%
Protein:
4.49 g
Fats:
16.07 g
Carbs:
53 g
Water:
24.96 g
Other:
1.48 g
3
10%
10%
46%
30%
4%
Protein:
9.76 g
Fats:
9.76 g
Carbs:
45.89 g
Water:
30.15 g
Other:
4.44 g
Contains
more
Fats Fats
+64.7%
Contains
more
Carbs Carbs
+15.5%
Contains
more
Protein Protein
+117.4%
Contains
more
Water Water
+20.8%
Contains
more
Other Other
+200%
Fat Type Comparison
Fat type breakdown side-by-side comparison
3
18%
31%
51%
Saturated fat:
Sat. Fat
2.844 g
Monounsaturated fat:
Mono. Fat
4.822 g
Polyunsaturated fat:
Poly. Fat
8.103 g
0
55%
34%
11%
Saturated fat:
Sat. Fat
4.878 g
Monounsaturated fat:
Mono. Fat
3.062 g
Polyunsaturated fat:
Poly. Fat
0.992 g
Contains
less
Sat. Fat Saturated fat
-41.7%
Contains
more
Mono. Fat Monounsaturated fat
+57.5%
Contains
more
Poly. Fat Polyunsaturated fat
+716.8%