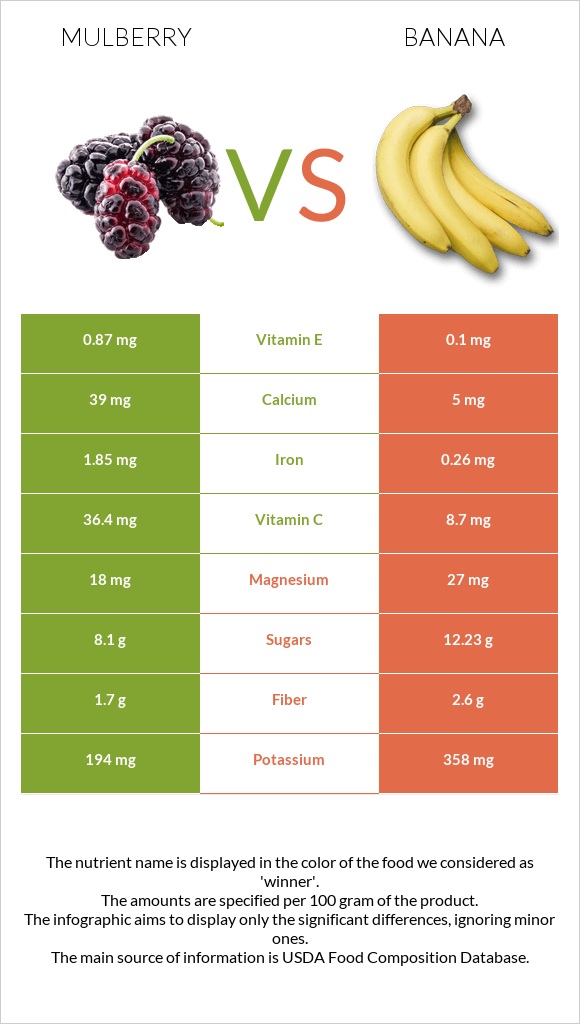
Significant differences between mulberries and bananas Mulberries are richer in vitamin C, iron, vitamin K, and vitamin E, while bananas are higher in vitamin B6. Mulberries cover your daily vitamin C needs 31% more than bananas. Mulberries have 16 times more vitamin K than bananas. Mulberries have 7.8µg of vitamin K, while bananas have 0.5µg. Mulberries are lower in sugar. Bananas have a higher glycemic index (48) than mulberries (25). Specific food types used in this comparison are Mulberries, raw and Bananas, raw .
Infographic
Mineral Comparison
Mineral comparison score is based on the number of minerals by which one or the other food is richer. The "coverage" charts below show how much of the daily needs can be covered by 300 grams of the food.
3
100 g
300 g
10 fruit - 15g 1 cup - 140g
Magnesium
Magnesium
Calcium
Calcium
Potassium
Potassium
Iron
Iron
Copper
Copper
Zinc
Zinc
Phosphorus
Phosphorus
Sodium
Sodium
Manganese
Manganese
Selenium
Selenium
13%
12%
17%
69%
20%
3.3%
16%
1.3%
0%
3.3%
7
100 g
300 g
1 extra small (less than 6" long) - 81g 1 small (6" to 6-7/8" long) - 101g 1 medium (7" to 7-7/8" long) - 118g 1 NLEA serving - 126g 1 large (8" to 8-7/8" long) - 136g 1 cup, sliced - 150g 1 extra large (9" or longer) - 152g 1 cup, mashed - 225g
Magnesium
Magnesium
Calcium
Calcium
Potassium
Potassium
Iron
Iron
Copper
Copper
Zinc
Zinc
Phosphorus
Phosphorus
Sodium
Sodium
Manganese
Manganese
Selenium
Selenium
19%
1.5%
32%
9.8%
26%
4.1%
9.4%
0.13%
35%
5.5%
Vitamin Comparison
Vitamin comparison score is based on the number of vitamins by which one or the other food is richer. The "coverage" charts below show how much of the daily needs can be covered by 300 grams of the food.
4
100 g
300 g
10 fruit - 15g 1 cup - 140g
Vitamin C
Vit. C
Vitamin D
Vit. D
Vitamin A
Vit. A
Vitamin E
Vit. E
Vitamin B1
Vit. B1
Vitamin B2
Vit. B2
Vitamin B3
Vit. B3
Vitamin B5
Vit. B5
Vitamin B6
Vit. B6
Vitamin B12
Vit. B12
Vitamin K
Vit. K
Folate
Folate
121%
0%
0.33%
17%
7.3%
23%
12%
0%
12%
0%
20%
4.5%
4
100 g
300 g
1 extra small (less than 6" long) - 81g 1 small (6" to 6-7/8" long) - 101g 1 medium (7" to 7-7/8" long) - 118g 1 NLEA serving - 126g 1 large (8" to 8-7/8" long) - 136g 1 cup, sliced - 150g 1 extra large (9" or longer) - 152g 1 cup, mashed - 225g
Vitamin C
Vit. C
Vitamin D
Vit. D
Vitamin A
Vit. A
Vitamin E
Vit. E
Vitamin B1
Vit. B1
Vitamin B2
Vit. B2
Vitamin B3
Vit. B3
Vitamin B5
Vit. B5
Vitamin B6
Vit. B6
Vitamin B12
Vit. B12
Vitamin K
Vit. K
Folate
Folate
29%
0%
1%
2%
7.8%
17%
12%
20%
85%
0%
1.3%
15%
All nutrients comparison - raw data values
Nutrient
DV% diff.
Vitamin C
36.4mg
8.7mg
31%
Vitamin B6
0.05mg
0.367mg
24%
Iron
1.85mg
0.26mg
20%
Manganese
0.27mg
12%
Vitamin B5
0.334mg
7%
Vitamin K
7.8µg
0.5µg
6%
Fructose
4.85g
6%
Potassium
194mg
358mg
5%
Vitamin E
0.87mg
0.1mg
5%
Carbs
9.8g
22.84g
4%
Fiber
1.7g
2.6g
4%
Folate
6µg
20µg
4%
Calcium
39mg
5mg
3%
Calories
43kcal
89kcal
2%
Magnesium
18mg
27mg
2%
Copper
0.06mg
0.078mg
2%
Starch
5.38g
2%
Phosphorus
38mg
22mg
2%
Vitamin B2
0.101mg
0.073mg
2%
Protein
1.44g
1.09g
1%
Selenium
0.6µg
1µg
1%
Polyunsaturated fat
0.207g
0.073g
1%
Protein per 100 calories
3.3g
1.2g
N/A
Calories per 10 g protein
299kcal
817kcal
N/A
Weight per 100 calories
233g
112g
N/A
Fats
0.39g
0.33g
0%
Net carbs
8.1g
20.24g
N/A
Sugar
8.1g
12.23g
N/A
Zinc
0.12mg
0.15mg
0%
Sodium
10mg
1mg
0%
Vitamin A
1µg
3µg
0%
Vitamin B1
0.029mg
0.031mg
0%
Vitamin B3
0.62mg
0.665mg
0%
Choline
12.3mg
9.8mg
0%
Saturated fat
0.027g
0.112g
0%
Monounsaturated fat
0.041g
0.032g
0%
Tryptophan
0.009mg
0%
Threonine
0.028mg
0%
Isoleucine
0.028mg
0%
Leucine
0.068mg
0%
Lysine
0.05mg
0%
Methionine
0.008mg
0%
Phenylalanine
0.049mg
0%
Valine
0.047mg
0%
Histidine
0.077mg
0%
Macronutrient Comparison
Macronutrient breakdown side-by-side comparison
3
10%
88%
Protein:
1.44 g
Fats:
0.39 g
Carbs:
9.8 g
Water:
87.68 g
Other:
0.69 g
2
23%
75%
Protein:
1.09 g
Fats:
0.33 g
Carbs:
22.84 g
Water:
74.91 g
Other:
0.83 g
Contains
more
Protein Protein
+32.1%
Contains
more
Fats Fats
+18.2%
Contains
more
Water Water
+17%
Contains
more
Carbs Carbs
+133.1%
Contains
more
Other Other
+20.3%
Fat Type Comparison
Fat type breakdown side-by-side comparison
3
10%
15%
75%
Saturated fat:
Sat. Fat
0.027 g
Monounsaturated fat:
Mono. Fat
0.041 g
Polyunsaturated fat:
Poly. Fat
0.207 g
0
52%
15%
34%
Saturated fat:
Sat. Fat
0.112 g
Monounsaturated fat:
Mono. Fat
0.032 g
Polyunsaturated fat:
Poly. Fat
0.073 g
Contains
less
Sat. Fat Saturated fat
-75.9%
Contains
more
Mono. Fat Monounsaturated fat
+28.1%
Contains
more
Poly. Fat Polyunsaturated fat
+183.6%