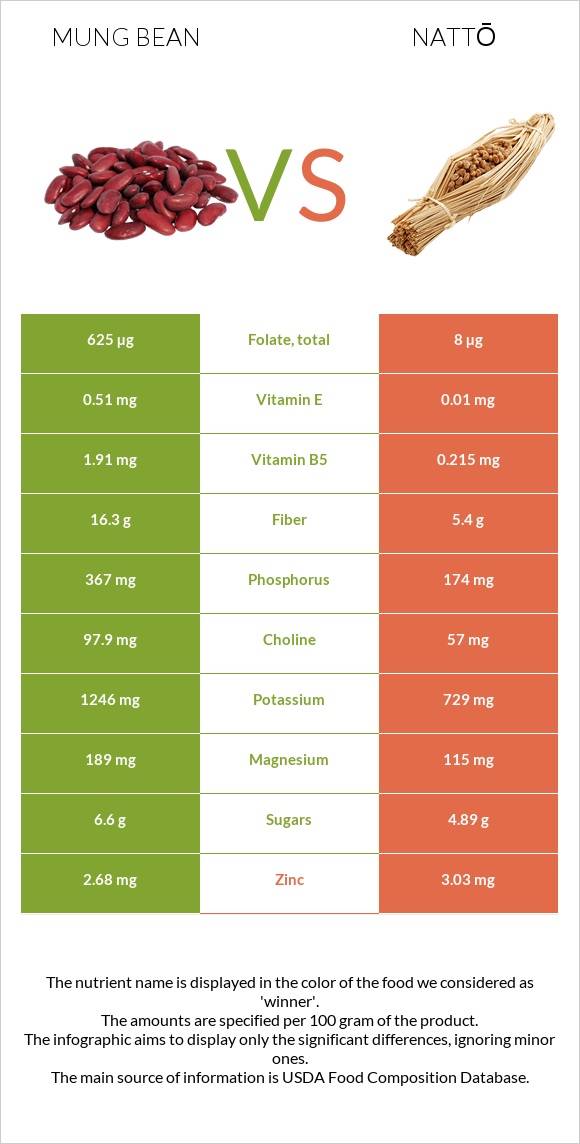
Summary of differences between mung beans and nattō Mung beans have more folate, fiber, vitamin B1, vitamin B5, copper, phosphorus, vitamin B6, and magnesium, while nattō has more iron and manganese. Mung beans cover your daily need for folate, 154% more than nattō. Mung beans contain 9 times more vitamin B5 than nattō. While mung beans contain 1.91mg of vitamin B5, nattō contains only 0.215mg. Mung beans have a lower glycemic index. The glycemic index of mung beans is 31, while the glycemic index of nattō is 56. These are the specific foods used in this comparison Mung beans, mature seeds, raw and Natto .
Infographic
Mineral Comparison
Mineral comparison score is based on the number of minerals by which one or the other food is richer. The "coverage" charts below show how much of the daily needs can be covered by 300 grams of the food.
4
100 g
300 g
1 tbsp - 13g 1 cup - 207g
Magnesium
Magnesium
Calcium
Calcium
Potassium
Potassium
Iron
Iron
Copper
Copper
Zinc
Zinc
Phosphorus
Phosphorus
Sodium
Sodium
Manganese
Manganese
Selenium
Selenium
135%
40%
110%
253%
314%
73%
157%
2%
135%
45%
5
100 g
300 g
1 cup - 175g
Magnesium
Magnesium
Calcium
Calcium
Potassium
Potassium
Iron
Iron
Copper
Copper
Zinc
Zinc
Phosphorus
Phosphorus
Sodium
Sodium
Manganese
Manganese
Selenium
Selenium
82%
65%
64%
323%
222%
83%
75%
0.91%
199%
48%
Vitamin Comparison
Vitamin comparison score is based on the number of vitamins by which one or the other food is richer. The "coverage" charts below show how much of the daily needs can be covered by 300 grams of the food.
8
100 g
300 g
1 tbsp - 13g 1 cup - 207g
Vitamin C
Vit. C
Vitamin D
Vit. D
Vitamin A
Vit. A
Vitamin E
Vit. E
Vitamin B1
Vit. B1
Vitamin B2
Vit. B2
Vitamin B3
Vit. B3
Vitamin B5
Vit. B5
Vitamin B6
Vit. B6
Vitamin B12
Vit. B12
Vitamin K
Vit. K
Folate
Folate
16%
0%
2%
10%
155%
54%
42%
115%
88%
0%
23%
469%
2
100 g
300 g
1 cup - 175g
Vitamin C
Vit. C
Vitamin D
Vit. D
Vitamin A
Vit. A
Vitamin E
Vit. E
Vitamin B1
Vit. B1
Vitamin B2
Vit. B2
Vitamin B3
Vit. B3
Vitamin B5
Vit. B5
Vitamin B6
Vit. B6
Vitamin B12
Vit. B12
Vitamin K
Vit. K
Folate
Folate
43%
0%
0%
0.2%
40%
44%
0%
13%
30%
0%
58%
6%
All nutrients comparison - raw data values
Nutrient
DV% diff.
Folate
625µg
8µg
154%
Fiber
16.3g
5.4g
44%
Polyunsaturated fat
0.384g
6.21g
39%
Vitamin B1
0.621mg
0.16mg
38%
Vitamin B5
1.91mg
0.215mg
34%
Copper
0.941mg
0.667mg
30%
Phosphorus
367mg
174mg
28%
Iron
6.74mg
8.6mg
23%
Manganese
1.035mg
1.528mg
21%
Vitamin B6
0.382mg
0.13mg
19%
Magnesium
189mg
115mg
18%
Carbs
62.62g
12.68g
17%
Fats
1.15g
11g
15%
Potassium
1246mg
729mg
15%
Vitamin B3
2.251mg
0mg
14%
Vitamin K
9µg
23.1µg
12%
Protein
23.86g
19.4g
9%
Vitamin C
4.8mg
13mg
9%
Calcium
132mg
217mg
9%
Calories
347kcal
211kcal
7%
Choline
97.9mg
57mg
7%
Saturated fat
0.348g
1.591g
6%
Monounsaturated fat
0.161g
2.43g
6%
Zinc
2.68mg
3.03mg
3%
Vitamin E
0.51mg
0.01mg
3%
Vitamin B2
0.233mg
0.19mg
3%
Vitamin A
6µg
0µg
1%
Selenium
8.2µg
8.8µg
1%
Protein per 100 calories
6.9g
9.2g
N/A
Calories per 10 g protein
145kcal
109kcal
N/A
Weight per 100 calories
29g
47g
N/A
Unsaturated / Saturated Fat ratio
1.6
5.4
N/A
Net carbs
46.32g
7.28g
N/A
Sugar
6.6g
4.89g
N/A
Sodium
15mg
7mg
0%
Tryptophan
0.26mg
0.223mg
0%
Threonine
0.782mg
0.813mg
0%
Isoleucine
1.008mg
0.931mg
0%
Leucine
1.847mg
1.509mg
0%
Lysine
1.664mg
1.145mg
0%
Methionine
0.286mg
0.208mg
0%
Phenylalanine
1.443mg
0.941mg
0%
Valine
1.237mg
1.018mg
0%
Histidine
0.695mg
0.512mg
0%
Macronutrient Comparison
Macronutrient breakdown side-by-side comparison
3
24%
63%
9%
3%
Protein:
23.86 g
Fats:
1.15 g
Carbs:
62.62 g
Water:
9.05 g
Other:
3.32 g
2
19%
11%
13%
55%
2%
Protein:
19.4 g
Fats:
11 g
Carbs:
12.68 g
Water:
55.02 g
Other:
1.9 g
Contains
more
Protein Protein
+23%
Contains
more
Carbs Carbs
+393.8%
Contains
more
Other Other
+74.7%
Contains
more
Fats Fats
+856.5%
Contains
more
Water Water
+508%
Fat Type Comparison
Fat type breakdown side-by-side comparison
1
39%
18%
43%
Saturated fat:
Sat. Fat
0.348 g
Monounsaturated fat:
Mono. Fat
0.161 g
Polyunsaturated fat:
Poly. Fat
0.384 g
2
16%
24%
61%
Saturated fat:
Sat. Fat
1.591 g
Monounsaturated fat:
Mono. Fat
2.43 g
Polyunsaturated fat:
Poly. Fat
6.21 g
Contains
less
Sat. Fat Saturated fat
-78.1%
Contains
more
Mono. Fat Monounsaturated fat
+1409.3%
Contains
more
Poly. Fat Polyunsaturated fat
+1517.2%