Brazil nut vs. Mixed nuts — In-Depth Nutrition Comparison
Compare
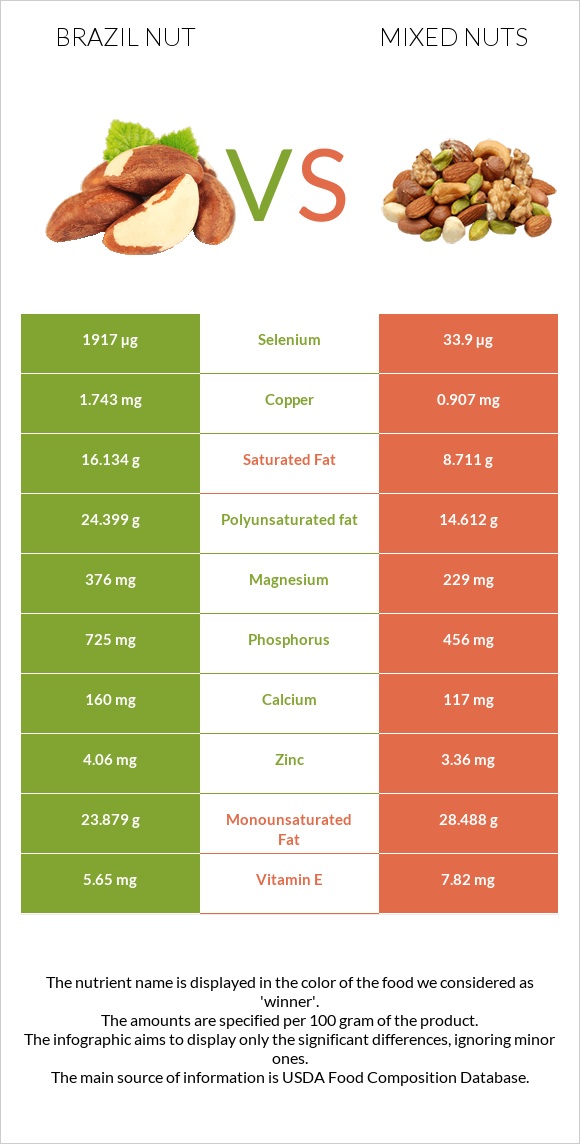
A recap on the differences between brazil nut and mixed nuts
- Brazil nut is higher in selenium, copper, phosphorus, vitamin B1, and magnesium, yet mixed nuts are higher in vitamin B3, manganese, vitamin B6, and vitamin B5.
- Brazil nut covers your daily selenium needs 3424% more than mixed nuts.
- Brazil nut contains 3 times more vitamin B1 than mixed nuts. While brazil nut contains 0.617mg of vitamin B1, mixed nuts contain only 0.189mg.
- The amount of saturated fat in mixed nuts is lower.
- The glycemic index of brazil nut is lower.
Food varieties used in this article are Nuts, brazilnuts, dried, unblanched and Nuts, mixed nuts, oil roasted, with peanuts, without salt added.
Infographic
Infographic link
Mineral Comparison
Mineral comparison score is based on the number of minerals by which one or the other food is richer. The "coverage" charts below show how much of the daily needs can be covered by 300 grams of the food.
| Contains more MagnesiumMagnesium | +64.2% |
| Contains more CalciumCalcium | +36.8% |
| Contains more CopperCopper | +92.2% |
| Contains more ZincZinc | +20.8% |
| Contains more PhosphorusPhosphorus | +59% |
| Contains less SodiumSodium | -40% |
| Contains more SeleniumSelenium | +5554.9% |
| Contains more ManganeseManganese | +66.8% |
Vitamin Comparison
Vitamin comparison score is based on the number of vitamins by which one or the other food is richer. The "coverage" charts below show how much of the daily needs can be covered by 300 grams of the food.
| Contains more Vitamin CVitamin C | +40% |
| Contains more Vitamin B1Vitamin B1 | +226.5% |
| Contains more Vitamin EVitamin E | +38.4% |
| Contains more Vitamin B2Vitamin B2 | +460% |
| Contains more Vitamin B3Vitamin B3 | +2513.2% |
| Contains more Vitamin B5Vitamin B5 | +519.6% |
| Contains more Vitamin B6Vitamin B6 | +248.5% |
| Contains more Vitamin KVitamin K | +∞% |
| Contains more FolateFolate | +277.3% |
All nutrients comparison - raw data values
| Nutrient |  |
 |
DV% diff. |
| Selenium | 1917µg | 33.9µg | 3424% |
| Copper | 1.743mg | 0.907mg | 93% |
| Polyunsaturated fat | 24.399g | 14.612g | 65% |
| Vitamin B3 | 0.295mg | 7.709mg | 46% |
| Phosphorus | 725mg | 456mg | 38% |
| Manganese | 1.223mg | 2.04mg | 36% |
| Vitamin B1 | 0.617mg | 0.189mg | 36% |
| Magnesium | 376mg | 229mg | 35% |
| Saturated fat | 16.134g | 8.711g | 34% |
| Fats | 67.1g | 53.95g | 20% |
| Vitamin B5 | 0.184mg | 1.14mg | 19% |
| Vitamin B6 | 0.101mg | 0.352mg | 19% |
| Folate | 22µg | 83µg | 15% |
| Vitamin E | 5.65mg | 7.82mg | 14% |
| Vitamin B2 | 0.035mg | 0.196mg | 12% |
| Monounsaturated fat | 23.879g | 28.488g | 12% |
| Protein | 14.32g | 20.04g | 11% |
| Zinc | 4.06mg | 3.36mg | 6% |
| Vitamin K | 0µg | 5.7µg | 5% |
| Calcium | 160mg | 117mg | 4% |
| Choline | 28.8mg | 52mg | 4% |
| Calories | 659kcal | 607kcal | 3% |
| Carbs | 11.74g | 21.05g | 3% |
| Iron | 2.43mg | 2.61mg | 2% |
| Fiber | 7.5g | 7g | 2% |
| Starch | 0.25g | 4.2g | 2% |
| Potassium | 659mg | 632mg | 1% |
| Protein per 100 calories | 2.2g | 3.3g | N/A |
| Calories per 10 g protein | 460kcal | 303kcal | N/A |
| Weight per 100 calories | 15g | 16g | N/A |
| Unsaturated / Saturated Fat ratio | 3 | 4.9 | N/A |
| Vitamin C | 0.7mg | 0.5mg | 0% |
| Net carbs | 4.24g | 14.05g | N/A |
| Sugar | 2.33g | 4.15g | N/A |
| Sodium | 3mg | 5mg | 0% |
| Trans fat | 0.055g | N/A | |
| Tryptophan | 0.135mg | 0.22mg | 0% |
| Threonine | 0.365mg | 0.703mg | 0% |
| Isoleucine | 0.518mg | 0.826mg | 0% |
| Leucine | 1.19mg | 1.656mg | 0% |
| Lysine | 0.49mg | 0.782mg | 0% |
| Methionine | 1.124mg | 0.283mg | 0% |
| Phenylalanine | 0.639mg | 1.182mg | 0% |
| Valine | 0.76mg | 1.001mg | 0% |
| Histidine | 0.409mg | 0.572mg | 0% |
| Omega-3 - EPA | 0g | 0.005g | N/A |
| Omega-3 - ALA | 0.018g | 0.082g | N/A |
| Omega-6 - Gamma-linoleic acid | 0.018g | 0g | N/A |
| Omega-6 - Eicosadienoic acid | 0g | 0.013g | N/A |
| Omega-6 - Linoleic acid | 23.859g | 14.455g | N/A |
Macronutrient Comparison
Macronutrient breakdown side-by-side comparison
Protein:
14.32 g
Fats:
67.1 g
Carbs:
11.74 g
Water:
3.42 g
Other:
3.42 g
Protein:
20.04 g
Fats:
53.95 g
Carbs:
21.05 g
Water:
2.08 g
Other:
2.88 g
| Contains more FatsFats | +24.4% |
| Contains more WaterWater | +64.4% |
| Contains more OtherOther | +18.8% |
| Contains more ProteinProtein | +39.9% |
| Contains more CarbsCarbs | +79.3% |
Fat Type Comparison
Fat type breakdown side-by-side comparison
Saturated fat:
Sat. Fat
16.134 g
Monounsaturated fat:
Mono. Fat
23.879 g
Polyunsaturated fat:
Poly. Fat
24.399 g
Saturated fat:
Sat. Fat
8.711 g
Monounsaturated fat:
Mono. Fat
28.488 g
Polyunsaturated fat:
Poly. Fat
14.612 g
| Contains more Poly. FatPolyunsaturated fat | +67% |
| Contains less Sat. FatSaturated fat | -46% |
| Contains more Mono. FatMonounsaturated fat | +19.3% |
Carbohydrate type comparison
Carbohydrate type breakdown side-by-side comparison
Starch:
0.25 g
Sucrose:
2.33 g
Glucose:
0 g
Fructose:
0 g
Lactose:
0 g
Maltose:
0 g
Galactose:
0 g
Starch:
4.2 g
Sucrose:
4.15 g
Glucose:
0 g
Fructose:
0 g
Lactose:
0 g
Maltose:
0 g
Galactose:
0 g
| Contains more StarchStarch | +1580% |
| Contains more SucroseSucrose | +78.1% |
~equal in
Glucose
~0g
~equal in
Fructose
~0g
~equal in
Lactose
~0g
~equal in
Maltose
~0g
~equal in
Galactose
~0g


