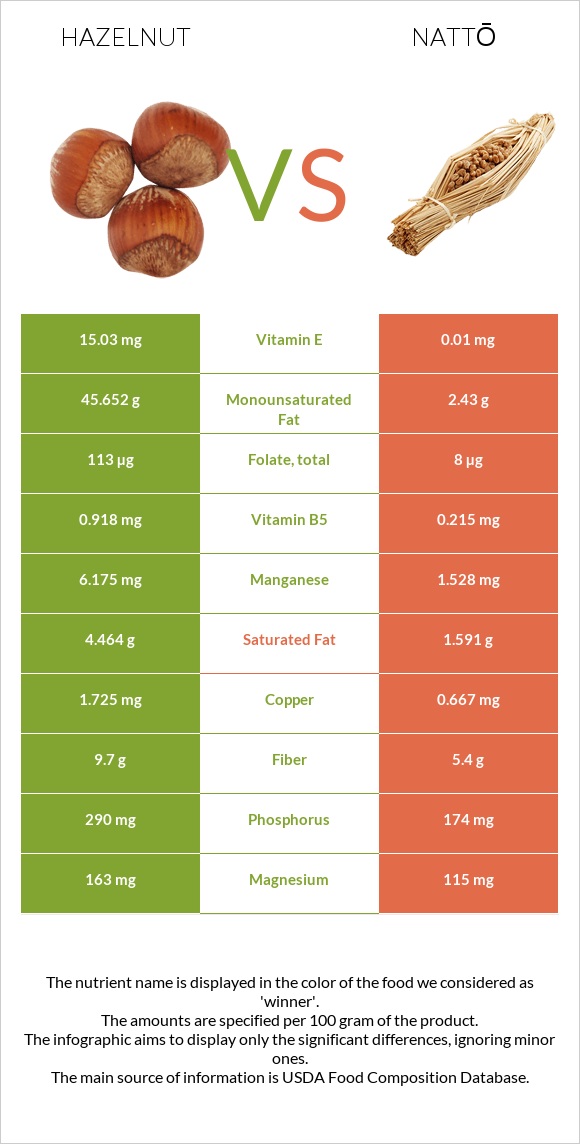
Summary of differences between hazelnut and nattō Hazelnut has more manganese, copper, vitamin E, vitamin B1, vitamin B6, folate, fiber, and phosphorus, while nattō has more iron. Hazelnut covers your daily need for manganese, 202% more than nattō. Hazelnut contains 1503 times more vitamin E than nattō. While hazelnut contains 15.03mg of vitamin E, nattō contains only 0.01mg. The amount of saturated fat in nattō is lower. Hazelnut has a lower glycemic index. The glycemic index of hazelnut is 15, while the glycemic index of nattō is 56. These are the specific foods used in this comparison Nuts, hazelnuts or filberts and Natto .
Infographic
Mineral Comparison
Mineral comparison score is based on the number of minerals by which one or the other food is richer. The "coverage" charts below show how much of the daily needs can be covered by 300 grams of the food.
5
100 g
300 g
10 nuts - 14g 1 oz (21 whole kernels) - 28.35g 1 cup, ground - 75g 1 cup, chopped - 115g 1 cup, whole - 135g
Magnesium
Magnesium
Calcium
Calcium
Potassium
Potassium
Iron
Iron
Copper
Copper
Zinc
Zinc
Phosphorus
Phosphorus
Sodium
Sodium
Manganese
Manganese
Selenium
Selenium
116%
34%
60%
176%
575%
67%
124%
0%
805%
13%
4
100 g
300 g
1 cup - 175g
Magnesium
Magnesium
Calcium
Calcium
Potassium
Potassium
Iron
Iron
Copper
Copper
Zinc
Zinc
Phosphorus
Phosphorus
Sodium
Sodium
Manganese
Manganese
Selenium
Selenium
82%
65%
64%
323%
222%
83%
75%
0.91%
199%
48%
Vitamin Comparison
Vitamin comparison score is based on the number of vitamins by which one or the other food is richer. The "coverage" charts below show how much of the daily needs can be covered by 300 grams of the food.
7
100 g
300 g
10 nuts - 14g 1 oz (21 whole kernels) - 28.35g 1 cup, ground - 75g 1 cup, chopped - 115g 1 cup, whole - 135g
Vitamin C
Vit. C
Vitamin D
Vit. D
Vitamin A
Vit. A
Vitamin E
Vit. E
Vitamin B1
Vit. B1
Vitamin B2
Vit. B2
Vitamin B3
Vit. B3
Vitamin B5
Vit. B5
Vitamin B6
Vit. B6
Vitamin B12
Vit. B12
Vitamin K
Vit. K
Folate
Folate
21%
0%
0.33%
301%
161%
26%
34%
55%
130%
0%
36%
85%
3
100 g
300 g
1 cup - 175g
Vitamin C
Vit. C
Vitamin D
Vit. D
Vitamin A
Vit. A
Vitamin E
Vit. E
Vitamin B1
Vit. B1
Vitamin B2
Vit. B2
Vitamin B3
Vit. B3
Vitamin B5
Vit. B5
Vitamin B6
Vit. B6
Vitamin B12
Vit. B12
Vitamin K
Vit. K
Folate
Folate
43%
0%
0%
0.2%
40%
44%
0%
13%
30%
0%
58%
6%
All nutrients comparison - raw data values
Nutrient
DV% diff.
Manganese
6.175mg
1.528mg
202%
Copper
1.725mg
0.667mg
118%
Monounsaturated fat
45.652g
2.43g
108%
Vitamin E
15.03mg
0.01mg
100%
Fats
60.75g
11g
77%
Iron
4.7mg
8.6mg
49%
Vitamin B1
0.643mg
0.16mg
40%
Vitamin B6
0.563mg
0.13mg
33%
Folate
113µg
8µg
26%
Calories
628kcal
211kcal
21%
Fiber
9.7g
5.4g
17%
Phosphorus
290mg
174mg
17%
Vitamin B5
0.918mg
0.215mg
14%
Saturated fat
4.464g
1.591g
13%
Selenium
2.4µg
8.8µg
12%
Magnesium
163mg
115mg
11%
Vitamin B3
1.8mg
0mg
11%
Polyunsaturated fat
7.92g
6.21g
11%
Calcium
114mg
217mg
10%
Protein
14.95g
19.4g
9%
Vitamin C
6.3mg
13mg
7%
Vitamin K
14.2µg
23.1µg
7%
Vitamin B2
0.113mg
0.19mg
6%
Zinc
2.45mg
3.03mg
5%
Choline
45.6mg
57mg
2%
Carbs
16.7g
12.68g
1%
Potassium
680mg
729mg
1%
Protein per 100 calories
2.4g
9.2g
N/A
Calories per 10 g protein
420kcal
109kcal
N/A
Weight per 100 calories
16g
47g
N/A
Unsaturated / Saturated Fat ratio
12
5.4
N/A
Net carbs
7g
7.28g
N/A
Sugar
4.34g
4.89g
N/A
Starch
0.48g
0%
Sodium
0mg
7mg
0%
Vitamin A
1µg
0µg
0%
Tryptophan
0.193mg
0.223mg
0%
Threonine
0.497mg
0.813mg
0%
Isoleucine
0.545mg
0.931mg
0%
Leucine
1.063mg
1.509mg
0%
Lysine
0.42mg
1.145mg
0%
Methionine
0.221mg
0.208mg
0%
Phenylalanine
0.663mg
0.941mg
0%
Valine
0.701mg
1.018mg
0%
Histidine
0.432mg
0.512mg
0%
Fructose
0.07g
0%
Macronutrient Comparison
Macronutrient breakdown side-by-side comparison
3
15%
61%
17%
5%
2%
Protein:
14.95 g
Fats:
60.75 g
Carbs:
16.7 g
Water:
5.31 g
Other:
2.29 g
2
19%
11%
13%
55%
2%
Protein:
19.4 g
Fats:
11 g
Carbs:
12.68 g
Water:
55.02 g
Other:
1.9 g
Contains
more
Fats Fats
+452.3%
Contains
more
Carbs Carbs
+31.7%
Contains
more
Other Other
+20.5%
Contains
more
Protein Protein
+29.8%
Contains
more
Water Water
+936.2%
Fat Type Comparison
Fat type breakdown side-by-side comparison
2
8%
79%
14%
Saturated fat:
Sat. Fat
4.464 g
Monounsaturated fat:
Mono. Fat
45.652 g
Polyunsaturated fat:
Poly. Fat
7.92 g
1
16%
24%
61%
Saturated fat:
Sat. Fat
1.591 g
Monounsaturated fat:
Mono. Fat
2.43 g
Polyunsaturated fat:
Poly. Fat
6.21 g
Contains
more
Mono. Fat Monounsaturated fat
+1778.7%
Contains
more
Poly. Fat Polyunsaturated fat
+27.5%
Contains
less
Sat. Fat Saturated fat
-64.4%