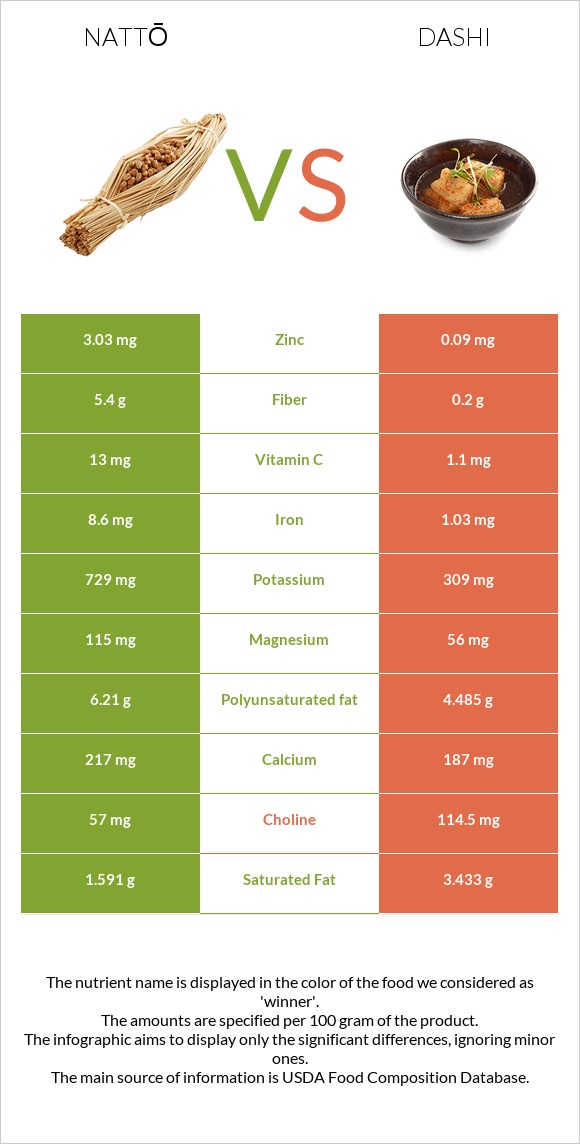
The main differences between nattō and dashi Nattō has more iron, copper, zinc, fiber, and magnesium; however, dashi has more vitamin K, selenium, vitamin B2, and vitamin B3. Daily need coverage for iron for nattō is 95% higher. Nattō is lower in sodium. Food types used in this article are Natto and Soup, bouillon cubes, and granules, low sodium, dry .
Infographic
Mineral Comparison
Mineral comparison score is based on the number of minerals by which one or the other food is richer. The "coverage" charts below show how much of the daily needs can be covered by 300 grams of the food.
8
100 g
300 g
1 cup - 175g
Magnesium
Magnesium
Calcium
Calcium
Potassium
Potassium
Iron
Iron
Copper
Copper
Zinc
Zinc
Phosphorus
Phosphorus
Sodium
Sodium
Manganese
Manganese
Selenium
Selenium
82%
65%
64%
323%
222%
83%
75%
0.91%
199%
48%
1
100 g
300 g
1 tsp - 2.6g 1 cube - 3.6g
Magnesium
Magnesium
Calcium
Calcium
Potassium
Potassium
Iron
Iron
Copper
Copper
Zinc
Zinc
Phosphorus
Phosphorus
Sodium
Sodium
Manganese
Manganese
Selenium
Selenium
40%
56%
27%
39%
0%
2.5%
71%
139%
0%
151%
Vitamin Comparison
Vitamin comparison score is based on the number of vitamins by which one or the other food is richer. The "coverage" charts below show how much of the daily needs can be covered by 300 grams of the food.
4
100 g
300 g
1 cup - 175g
Vitamin C
Vit. C
Vitamin D
Vit. D
Vitamin A
Vit. A
Vitamin E
Vit. E
Vitamin B1
Vit. B1
Vitamin B2
Vit. B2
Vitamin B3
Vit. B3
Vitamin B5
Vit. B5
Vitamin B6
Vit. B6
Vitamin B12
Vit. B12
Vitamin K
Vit. K
Folate
Folate
43%
0%
0%
0.2%
40%
44%
0%
13%
30%
0%
58%
6%
7
100 g
300 g
1 tsp - 2.6g 1 cube - 3.6g
Vitamin C
Vit. C
Vitamin D
Vit. D
Vitamin A
Vit. A
Vitamin E
Vit. E
Vitamin B1
Vit. B1
Vitamin B2
Vit. B2
Vitamin B3
Vit. B3
Vitamin B5
Vit. B5
Vitamin B6
Vit. B6
Vitamin B12
Vit. B12
Vitamin K
Vit. K
Folate
Folate
3.7%
0%
8.3%
14%
25%
99%
46%
0%
23%
38%
167%
16%
All nutrients comparison - raw data values
Nutrient
DV% diff.
Iron
8.6mg
1.03mg
95%
Copper
0.667mg
0mg
74%
Manganese
1.528mg
66%
Sodium
7mg
1067mg
46%
Vitamin K
23.1µg
66.9µg
37%
Selenium
8.8µg
27.6µg
34%
Zinc
3.03mg
0.09mg
27%
Fiber
5.4g
0.2g
21%
Vitamin B2
0.19mg
0.43mg
18%
Carbs
12.68g
64.88g
17%
Vitamin B3
0mg
2.46mg
15%
Magnesium
115mg
56mg
14%
Vitamin C
13mg
1.1mg
13%
Vitamin B12
0µg
0.3µg
13%
Potassium
729mg
309mg
12%
Polyunsaturated fat
6.21g
4.485g
12%
Calories
211kcal
438kcal
11%
Choline
57mg
114.5mg
10%
Saturated fat
1.591g
3.433g
8%
Monounsaturated fat
2.43g
5.365g
7%
Protein
19.4g
16.7g
5%
Vitamin E
0.01mg
0.72mg
5%
Vitamin B1
0.16mg
0.1mg
5%
Fats
11g
13.89g
4%
Cholesterol
0mg
13mg
4%
Vitamin B5
0.215mg
4%
Calcium
217mg
187mg
3%
Vitamin A
0µg
25µg
3%
Folate
8µg
21µg
3%
Vitamin B6
0.13mg
0.1mg
2%
Phosphorus
174mg
166mg
1%
Protein per 100 calories
9.2g
3.8g
N/A
Calories per 10 g protein
109kcal
262kcal
N/A
Weight per 100 calories
47g
23g
N/A
Unsaturated / Saturated Fat ratio
5.4
2.9
N/A
Net carbs
7.28g
64.68g
N/A
Sugar
4.89g
14.47g
N/A
Tryptophan
0.223mg
0%
Threonine
0.813mg
0%
Isoleucine
0.931mg
0%
Leucine
1.509mg
0%
Lysine
1.145mg
0%
Methionine
0.208mg
0%
Phenylalanine
0.941mg
0%
Valine
1.018mg
0%
Histidine
0.512mg
0%
Macronutrient Comparison
Macronutrient breakdown side-by-side comparison
2
19%
11%
13%
55%
2%
Protein:
19.4 g
Fats:
11 g
Carbs:
12.68 g
Water:
55.02 g
Other:
1.9 g
3
17%
14%
65%
2%
2%
Protein:
16.7 g
Fats:
13.89 g
Carbs:
64.88 g
Water:
2.3 g
Other:
2.23 g
Contains
more
Protein Protein
+16.2%
Contains
more
Water Water
+2292.2%
Contains
more
Fats Fats
+26.3%
Contains
more
Carbs Carbs
+411.7%
Contains
more
Other Other
+17.4%
Fat Type Comparison
Fat type breakdown side-by-side comparison
2
16%
24%
61%
Saturated fat:
Sat. Fat
1.591 g
Monounsaturated fat:
Mono. Fat
2.43 g
Polyunsaturated fat:
Poly. Fat
6.21 g
1
26%
40%
34%
Saturated fat:
Sat. Fat
3.433 g
Monounsaturated fat:
Mono. Fat
5.365 g
Polyunsaturated fat:
Poly. Fat
4.485 g
Contains
less
Sat. Fat Saturated fat
-53.7%
Contains
more
Poly. Fat Polyunsaturated fat
+38.5%
Contains
more
Mono. Fat Monounsaturated fat
+120.8%