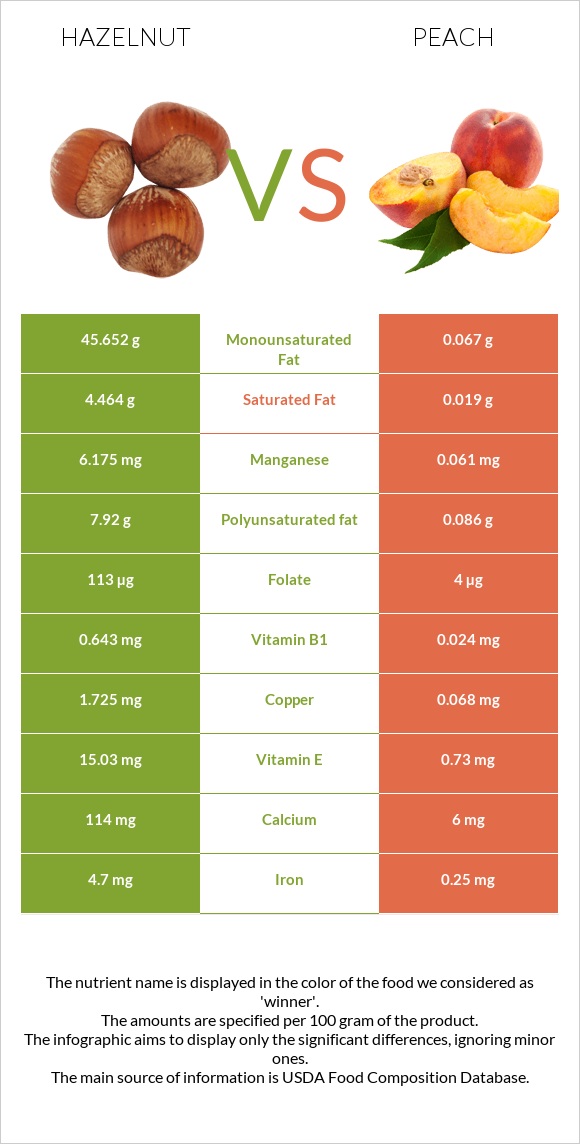
What are the main differences between hazelnut and peach? Peach has less manganese, copper, vitamin E, iron, vitamin B1, vitamin B6, phosphorus, magnesium, fiber, and folate than hazelnut. Hazelnut's daily need coverage for manganese is 266% higher. Hazelnut has 28 times more folate than peach. Hazelnut has 113µg of folate, while peach has 4µg. Hazelnut has a lower glycemic index than peach. We used Nuts, hazelnuts or filberts and Peaches, yellow, raw types in this comparison.
Infographic
Mineral Comparison
Mineral comparison score is based on the number of minerals by which one or the other food is richer. The "coverage" charts below show how much of the daily needs can be covered by 300 grams of the food.
9
100 g
300 g
10 nuts - 14g 1 oz (21 whole kernels) - 28.35g 1 cup, ground - 75g 1 cup, chopped - 115g 1 cup, whole - 135g
Magnesium
Magnesium
Calcium
Calcium
Potassium
Potassium
Iron
Iron
Copper
Copper
Zinc
Zinc
Phosphorus
Phosphorus
Sodium
Sodium
Manganese
Manganese
Selenium
Selenium
116%
34%
60%
176%
575%
67%
124%
0%
805%
13%
0
100 g
300 g
1 small (2-1/2" dia) - 130g 1 NLEA serving - 147g 1 medium (2-2/3" dia) - 150g 1 cup slices - 154g 1 large (2-3/4" dia) - 175g 1 extra large (3" dia) - 224g
Magnesium
Magnesium
Calcium
Calcium
Potassium
Potassium
Iron
Iron
Copper
Copper
Zinc
Zinc
Phosphorus
Phosphorus
Sodium
Sodium
Manganese
Manganese
Selenium
Selenium
6.4%
1.8%
17%
9.4%
23%
4.6%
8.6%
0%
8%
0.55%
Vitamin Comparison
Vitamin comparison score is based on the number of vitamins by which one or the other food is richer. The "coverage" charts below show how much of the daily needs can be covered by 300 grams of the food.
8
100 g
300 g
10 nuts - 14g 1 oz (21 whole kernels) - 28.35g 1 cup, ground - 75g 1 cup, chopped - 115g 1 cup, whole - 135g
Vitamin C
Vit. C
Vitamin D
Vit. D
Vitamin A
Vit. A
Vitamin E
Vit. E
Vitamin B1
Vit. B1
Vitamin B2
Vit. B2
Vitamin B3
Vit. B3
Vitamin B5
Vit. B5
Vitamin B6
Vit. B6
Vitamin B12
Vit. B12
Vitamin K
Vit. K
Folate
Folate
21%
0%
0.33%
301%
161%
26%
34%
55%
130%
0%
36%
85%
1
100 g
300 g
1 small (2-1/2" dia) - 130g 1 NLEA serving - 147g 1 medium (2-2/3" dia) - 150g 1 cup slices - 154g 1 large (2-3/4" dia) - 175g 1 extra large (3" dia) - 224g
Vitamin C
Vit. C
Vitamin D
Vit. D
Vitamin A
Vit. A
Vitamin E
Vit. E
Vitamin B1
Vit. B1
Vitamin B2
Vit. B2
Vitamin B3
Vit. B3
Vitamin B5
Vit. B5
Vitamin B6
Vit. B6
Vitamin B12
Vit. B12
Vitamin K
Vit. K
Folate
Folate
22%
0%
5.3%
15%
6%
7.2%
15%
9.2%
5.8%
0%
6.5%
3%
All nutrients comparison - raw data values
Nutrient
DV% diff.
Manganese
6.175mg
0.061mg
266%
Copper
1.725mg
0.068mg
184%
Monounsaturated fat
45.652g
0.067g
114%
Vitamin E
15.03mg
0.73mg
95%
Fats
60.75g
0.25g
93%
Iron
4.7mg
0.25mg
56%
Vitamin B1
0.643mg
0.024mg
52%
Polyunsaturated fat
7.92g
0.086g
52%
Vitamin B6
0.563mg
0.025mg
41%
Phosphorus
290mg
20mg
39%
Magnesium
163mg
9mg
37%
Fiber
9.7g
1.5g
33%
Calories
628kcal
39kcal
29%
Protein
14.95g
0.91g
28%
Folate
113µg
4µg
27%
Zinc
2.45mg
0.17mg
21%
Saturated fat
4.464g
0.019g
20%
Vitamin B5
0.918mg
0.153mg
15%
Potassium
680mg
190mg
14%
Calcium
114mg
6mg
11%
Vitamin K
14.2µg
2.6µg
10%
Choline
45.6mg
6.1mg
7%
Vitamin B2
0.113mg
0.031mg
6%
Vitamin B3
1.8mg
0.806mg
6%
Selenium
2.4µg
0.1µg
4%
Carbs
16.7g
9.54g
2%
Vitamin A
1µg
16µg
2%
Fructose
0.07g
1.53g
2%
Protein per 100 calories
2.4g
2.3g
N/A
Calories per 10 g protein
420kcal
429kcal
N/A
Weight per 100 calories
16g
256g
N/A
Unsaturated / Saturated Fat ratio
12
8.1
N/A
Vitamin C
6.3mg
6.6mg
0%
Net carbs
7g
8.04g
N/A
Sugar
4.34g
8.39g
N/A
Starch
0.48g
0g
0%
Tryptophan
0.193mg
0.01mg
0%
Threonine
0.497mg
0.016mg
0%
Isoleucine
0.545mg
0.017mg
0%
Leucine
1.063mg
0.027mg
0%
Lysine
0.42mg
0.03mg
0%
Methionine
0.221mg
0.01mg
0%
Phenylalanine
0.663mg
0.019mg
0%
Valine
0.701mg
0.022mg
0%
Histidine
0.432mg
0.013mg
0%
Macronutrient Comparison
Macronutrient breakdown side-by-side comparison
4
15%
61%
17%
5%
2%
Protein:
14.95 g
Fats:
60.75 g
Carbs:
16.7 g
Water:
5.31 g
Other:
2.29 g
1
10%
89%
Protein:
0.91 g
Fats:
0.25 g
Carbs:
9.54 g
Water:
88.87 g
Other:
0.43 g
Contains
more
Protein Protein
+1542.9%
Contains
more
Fats Fats
+24200%
Contains
more
Carbs Carbs
+75.1%
Contains
more
Other Other
+432.6%
Contains
more
Water Water
+1573.6%
Fat Type Comparison
Fat type breakdown side-by-side comparison
2
8%
79%
14%
Saturated fat:
Sat. Fat
4.464 g
Monounsaturated fat:
Mono. Fat
45.652 g
Polyunsaturated fat:
Poly. Fat
7.92 g
1
11%
39%
50%
Saturated fat:
Sat. Fat
0.019 g
Monounsaturated fat:
Mono. Fat
0.067 g
Polyunsaturated fat:
Poly. Fat
0.086 g
Contains
more
Mono. Fat Monounsaturated fat
+68037.3%
Contains
more
Poly. Fat Polyunsaturated fat
+9109.3%
Contains
less
Sat. Fat Saturated fat
-99.6%
Carbohydrate type comparison
Carbohydrate type breakdown side-by-side comparison
1
10%
87%
Starch:
0.48 g
Sucrose:
4.2 g
Glucose:
0.07 g
Fructose:
0.07 g
Lactose:
0 g
Maltose:
0 g
Galactose:
0 g
5
57%
23%
18%
Starch:
0 g
Sucrose:
4.76 g
Glucose:
1.95 g
Fructose:
1.53 g
Lactose:
0 g
Maltose:
0.08 g
Galactose:
0.06 g
Contains
more
Starch Starch
+∞%
Contains
more
Sucrose Sucrose
+13.3%
Contains
more
Glucose Glucose
+2685.7%
Contains
more
Fructose Fructose
+2085.7%
Contains
more
Maltose Maltose
+∞%
Contains
more
Galactose Galactose
+∞%