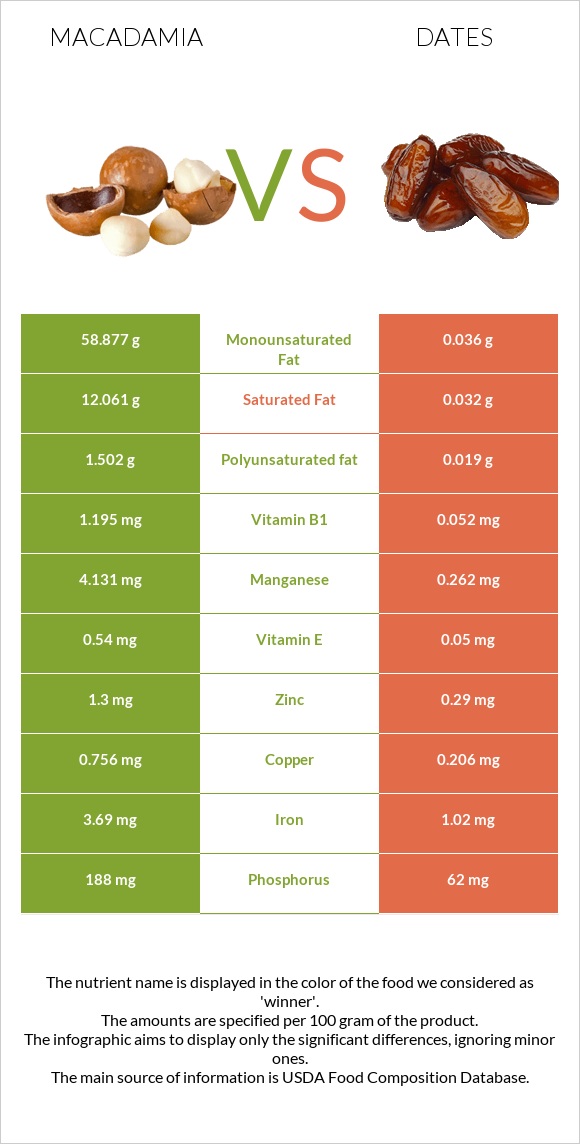
How are macadamia and dates different? Macadamia is richer in manganese, vitamin B1, copper, iron, magnesium, phosphorus, zinc, and vitamin B6, while dates are higher in potassium. Macadamia covers your daily need for manganese, 168% more than dates. Macadamia contains 377 times more saturated fat than dates. Macadamia contains 12.061g of saturated fat, while dates contain 0.032g. Dates have a higher glycemic index (42) than macadamia (10). Nuts, macadamia nuts, raw and Dates, deglet noor types were used in this article.
Infographic
Mineral Comparison
Mineral comparison score is based on the number of minerals by which one or the other food is richer. The "coverage" charts below show how much of the daily needs can be covered by 300 grams of the food.
8
100 g
300 g
1 oz (10-12 kernels) - 28.35g 1 cup, whole or halves - 134g
Magnesium
Magnesium
Calcium
Calcium
Potassium
Potassium
Iron
Iron
Copper
Copper
Zinc
Zinc
Phosphorus
Phosphorus
Sodium
Sodium
Manganese
Manganese
Selenium
Selenium
93%
26%
32%
138%
252%
35%
81%
0.65%
539%
20%
2
100 g
300 g
1 date, pitted - 7.1g 1 cup, chopped - 147g
Magnesium
Magnesium
Calcium
Calcium
Potassium
Potassium
Iron
Iron
Copper
Copper
Zinc
Zinc
Phosphorus
Phosphorus
Sodium
Sodium
Manganese
Manganese
Selenium
Selenium
31%
12%
58%
38%
69%
7.9%
27%
0.26%
34%
16%
Vitamin Comparison
Vitamin comparison score is based on the number of vitamins by which one or the other food is richer. The "coverage" charts below show how much of the daily needs can be covered by 300 grams of the food.
7
100 g
300 g
1 oz (10-12 kernels) - 28.35g 1 cup, whole or halves - 134g
Vitamin C
Vit. C
Vitamin D
Vit. D
Vitamin A
Vit. A
Vitamin E
Vit. E
Vitamin B1
Vit. B1
Vitamin B2
Vit. B2
Vitamin B3
Vit. B3
Vitamin B5
Vit. B5
Vitamin B6
Vit. B6
Vitamin B12
Vit. B12
Vitamin K
Vit. K
Folate
Folate
4%
0%
0%
11%
299%
37%
46%
45%
63%
0%
0%
8.3%
2
100 g
300 g
1 date, pitted - 7.1g 1 cup, chopped - 147g
Vitamin C
Vit. C
Vitamin D
Vit. D
Vitamin A
Vit. A
Vitamin E
Vit. E
Vitamin B1
Vit. B1
Vitamin B2
Vit. B2
Vitamin B3
Vit. B3
Vitamin B5
Vit. B5
Vitamin B6
Vit. B6
Vitamin B12
Vit. B12
Vitamin K
Vit. K
Folate
Folate
1.3%
0%
0%
1%
13%
15%
24%
35%
38%
0%
6.8%
14%
All nutrients comparison - raw data values
Nutrient
DV% diff.
Manganese
4.131mg
0.262mg
168%
Monounsaturated fat
58.877g
0.036g
147%
Fats
75.77g
0.39g
116%
Vitamin B1
1.195mg
0.052mg
95%
Copper
0.756mg
0.206mg
61%
Saturated fat
12.061g
0.032g
55%
Iron
3.69mg
1.02mg
33%
Fructose
0.07g
19.56g
24%
Calories
718kcal
282kcal
22%
Magnesium
130mg
43mg
21%
Carbs
13.82g
75.03g
20%
Phosphorus
188mg
62mg
18%
Protein
7.91g
2.45g
11%
Polyunsaturated fat
1.502g
0.019g
10%
Zinc
1.3mg
0.29mg
9%
Potassium
368mg
656mg
8%
Vitamin B6
0.275mg
0.165mg
8%
Vitamin B2
0.162mg
0.066mg
7%
Vitamin B3
2.473mg
1.274mg
7%
Calcium
85mg
39mg
5%
Vitamin E
0.54mg
0.05mg
3%
Vitamin B5
0.758mg
0.589mg
3%
Fiber
8.6g
8g
2%
Vitamin K
2.7µg
2%
Folate
11µg
19µg
2%
Vitamin C
1.2mg
0.4mg
1%
Selenium
3.6µg
3µg
1%
Choline
6.3mg
1%
Protein per 100 calories
1.1g
0.87g
N/A
Calories per 10 g protein
908kcal
1151kcal
N/A
Weight per 100 calories
14g
35g
N/A
Unsaturated / Saturated Fat ratio
5
1.7
N/A
Net carbs
5.22g
67.03g
N/A
Sugar
4.57g
63.35g
N/A
Starch
1.05g
0%
Sodium
5mg
2mg
0%
Tryptophan
0.067mg
0.012mg
0%
Threonine
0.37mg
0.043mg
0%
Isoleucine
0.314mg
0.049mg
0%
Leucine
0.602mg
0.084mg
0%
Lysine
0.018mg
0.066mg
0%
Methionine
0.023mg
0.022mg
0%
Phenylalanine
0.665mg
0.05mg
0%
Valine
0.363mg
0.071mg
0%
Histidine
0.195mg
0.032mg
0%
Macronutrient Comparison
Macronutrient breakdown side-by-side comparison
2
8%
76%
14%
Protein:
7.91 g
Fats:
75.77 g
Carbs:
13.82 g
Water:
1.36 g
Other:
1.14 g
3
2%
75%
21%
Protein:
2.45 g
Fats:
0.39 g
Carbs:
75.03 g
Water:
20.53 g
Other:
1.6 g
Contains
more
Protein Protein
+222.9%
Contains
more
Fats Fats
+19328.2%
Contains
more
Carbs Carbs
+442.9%
Contains
more
Water Water
+1409.6%
Contains
more
Other Other
+40.4%
Fat Type Comparison
Fat type breakdown side-by-side comparison
2
17%
81%
2%
Saturated fat:
Sat. Fat
12.061 g
Monounsaturated fat:
Mono. Fat
58.877 g
Polyunsaturated fat:
Poly. Fat
1.502 g
1
37%
41%
22%
Saturated fat:
Sat. Fat
0.032 g
Monounsaturated fat:
Mono. Fat
0.036 g
Polyunsaturated fat:
Poly. Fat
0.019 g
Contains
more
Mono. Fat Monounsaturated fat
+163447.2%
Contains
more
Poly. Fat Polyunsaturated fat
+7805.3%
Contains
less
Sat. Fat Saturated fat
-99.7%
Carbohydrate type comparison
Carbohydrate type breakdown side-by-side comparison
1
19%
79%
Starch:
1.05 g
Sucrose:
4.43 g
Glucose:
0.07 g
Fructose:
0.07 g
Lactose:
0 g
Maltose:
0 g
Galactose:
0 g
4
38%
31%
31%
Starch:
0 g
Sucrose:
23.84 g
Glucose:
19.87 g
Fructose:
19.56 g
Lactose:
0 g
Maltose:
0.12 g
Galactose:
0 g
Contains
more
Starch Starch
+∞%
Contains
more
Sucrose Sucrose
+438.1%
Contains
more
Glucose Glucose
+28285.7%
Contains
more
Fructose Fructose
+27842.9%
Contains
more
Maltose Maltose
+∞%
~equal in
Lactose
~0g
~equal in
Galactose
~0g