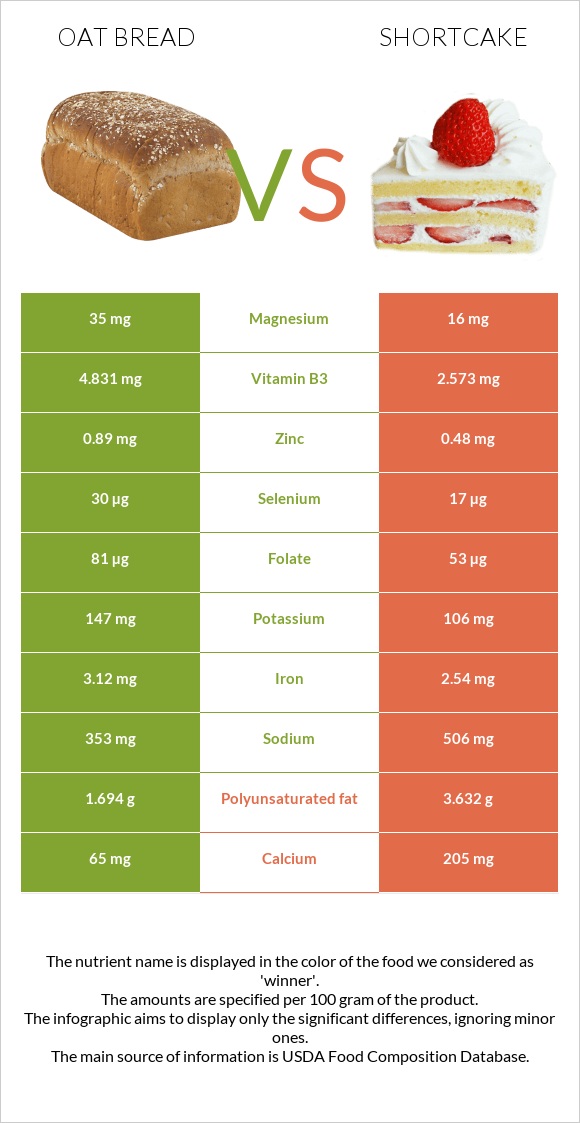
Summary of differences between oat bread and shortcake Oat bread has more selenium, manganese, vitamin B1, vitamin B3, iron, folate, and vitamin B5; however, shortcake is higher in calcium. Oat bread covers your daily need for selenium, 24% more than shortcake. Oat bread has 2 times more manganese than shortcake. While oat bread has 0.779mg of manganese, shortcake has only 0.33mg. Oat bread has less sodium. These are the specific foods used in this comparison Bread, oat bran and Cake, shortcake, biscuit-type, prepared from recipe .
Infographic
Mineral Comparison
Mineral comparison score is based on the number of minerals by which one or the other food is richer. The "coverage" charts below show how much of the daily needs can be covered by 300 grams of the food.
8
100 g
300 g
1 oz - 28.35g 1 slice - 30g
Magnesium
Magnesium
Calcium
Calcium
Potassium
Potassium
Iron
Iron
Copper
Copper
Zinc
Zinc
Phosphorus
Phosphorus
Sodium
Sodium
Manganese
Manganese
Selenium
Selenium
25%
20%
13%
117%
45%
24%
60%
46%
102%
164%
1
100 g
300 g
1 oz - 28.35g
Magnesium
Magnesium
Calcium
Calcium
Potassium
Potassium
Iron
Iron
Copper
Copper
Zinc
Zinc
Phosphorus
Phosphorus
Sodium
Sodium
Manganese
Manganese
Selenium
Selenium
11%
62%
9.4%
95%
25%
13%
61%
66%
43%
93%
Vitamin Comparison
Vitamin comparison score is based on the number of vitamins by which one or the other food is richer. The "coverage" charts below show how much of the daily needs can be covered by 300 grams of the food.
8
100 g
300 g
1 oz - 28.35g 1 slice - 30g
Vitamin C
Vit. C
Vitamin D
Vit. D
Vitamin A
Vit. A
Vitamin E
Vit. E
Vitamin B1
Vit. B1
Vitamin B2
Vit. B2
Vitamin B3
Vit. B3
Vitamin B5
Vit. B5
Vitamin B6
Vit. B6
Vitamin B12
Vit. B12
Vitamin K
Vit. K
Folate
Folate
0%
0%
0.67%
8.8%
126%
80%
91%
35%
17%
0%
3%
61%
3
100 g
300 g
1 oz - 28.35g
Vitamin C
Vit. C
Vitamin D
Vit. D
Vitamin A
Vit. A
Vitamin E
Vit. E
Vitamin B1
Vit. B1
Vitamin B2
Vit. B2
Vitamin B3
Vit. B3
Vitamin B5
Vit. B5
Vitamin B6
Vit. B6
Vitamin B12
Vit. B12
Vitamin K
Vit. K
Folate
Folate
0.67%
0%
6%
0%
78%
63%
48%
15%
6.9%
8.8%
0%
40%
All nutrients comparison - raw data values
Nutrient
DV% diff.
Selenium
30µg
17µg
24%
Manganese
0.779mg
0.33mg
20%
Fiber
4.5g
18%
Vitamin B1
0.504mg
0.311mg
16%
Fats
4.4g
14.2g
15%
Calcium
65mg
205mg
14%
Vitamin B3
4.831mg
2.573mg
14%
Saturated fat
0.697g
3.772g
14%
Polyunsaturated fat
1.694g
3.632g
13%
Monounsaturated fat
1.59g
6.045g
11%
Protein
10.4g
6.1g
9%
Iron
3.12mg
2.54mg
7%
Copper
0.135mg
0.076mg
7%
Sodium
353mg
506mg
7%
Vitamin B5
0.581mg
0.248mg
7%
Folate
81µg
53µg
7%
Calories
236kcal
346kcal
6%
Vitamin B2
0.346mg
0.272mg
6%
Magnesium
35mg
16mg
5%
Zinc
0.89mg
0.48mg
4%
Carbs
39.8g
48.5g
3%
Vitamin E
0.44mg
3%
Vitamin B6
0.073mg
0.03mg
3%
Vitamin B12
0µg
0.07µg
3%
Choline
18.7mg
3%
Vitamin A
2µg
18µg
2%
Cholesterol
0mg
3mg
1%
Potassium
147mg
106mg
1%
Vitamin K
1.2µg
1%
Protein per 100 calories
4.4g
1.8g
N/A
Calories per 10 g protein
227kcal
567kcal
N/A
Weight per 100 calories
42g
29g
N/A
Unsaturated / Saturated Fat ratio
4.7
2.6
N/A
Vitamin C
0mg
0.2mg
0%
Net carbs
35.3g
48.5g
N/A
Sugar
7.7g
N/A
Phosphorus
141mg
143mg
0%
Tryptophan
0.131mg
0.076mg
0%
Threonine
0.299mg
0.184mg
0%
Isoleucine
0.399mg
0.238mg
0%
Leucine
0.733mg
0.449mg
0%
Lysine
0.297mg
0.197mg
0%
Methionine
0.179mg
0.115mg
0%
Phenylalanine
0.518mg
0.302mg
0%
Valine
0.461mg
0.273mg
0%
Histidine
0.225mg
0.14mg
0%
Macronutrient Comparison
Macronutrient breakdown side-by-side comparison
2
10%
4%
40%
44%
Protein:
10.4 g
Fats:
4.4 g
Carbs:
39.8 g
Water:
44 g
Other:
1.4 g
3
6%
14%
49%
28%
3%
Protein:
6.1 g
Fats:
14.2 g
Carbs:
48.5 g
Water:
28.4 g
Other:
2.8 g
Contains
more
Protein Protein
+70.5%
Contains
more
Water Water
+54.9%
Contains
more
Fats Fats
+222.7%
Contains
more
Carbs Carbs
+21.9%
Contains
more
Other Other
+100%
Fat Type Comparison
Fat type breakdown side-by-side comparison
1
18%
40%
43%
Saturated fat:
Sat. Fat
0.697 g
Monounsaturated fat:
Mono. Fat
1.59 g
Polyunsaturated fat:
Poly. Fat
1.694 g
2
28%
45%
27%
Saturated fat:
Sat. Fat
3.772 g
Monounsaturated fat:
Mono. Fat
6.045 g
Polyunsaturated fat:
Poly. Fat
3.632 g
Contains
less
Sat. Fat Saturated fat
-81.5%
Contains
more
Mono. Fat Monounsaturated fat
+280.2%
Contains
more
Poly. Fat Polyunsaturated fat
+114.4%