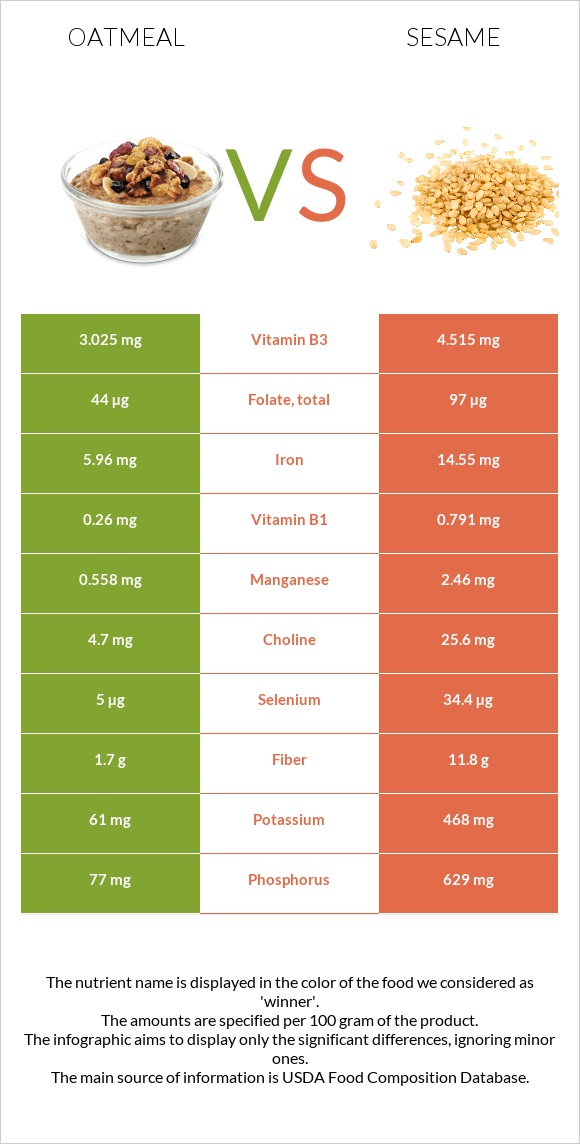
What are the main differences between oatmeal and sesame? Oatmeal has less copper, iron, calcium, manganese, phosphorus, magnesium, zinc, selenium, vitamin B1, and fiber than sesame. Sesame's daily need coverage for copper is 446% higher. We used Cereals, oats, instant, fortified, plain, prepared with water (boiling water added or microwaved) and Seeds, sesame seeds, whole, dried types in this comparison.
Infographic
Mineral Comparison
Mineral comparison score is based on the number of minerals by which one or the other food is richer. The "coverage" charts below show how much of the daily needs can be covered by 300 grams of the food.
0
100 g
300 g
1 oz, dry, yields - 177g 1 packet, dry, yields - 177g 1 cup, cooked - 234g 1 cup, dry, yields - 501g
Magnesium
Magnesium
Calcium
Calcium
Potassium
Potassium
Iron
Iron
Copper
Copper
Zinc
Zinc
Phosphorus
Phosphorus
Sodium
Sodium
Manganese
Manganese
Selenium
Selenium
19%
24%
5.4%
224%
22%
17%
33%
6.4%
73%
27%
10
100 g
300 g
1 tbsp - 9g 1 cup - 144g
Magnesium
Magnesium
Calcium
Calcium
Potassium
Potassium
Iron
Iron
Copper
Copper
Zinc
Zinc
Phosphorus
Phosphorus
Sodium
Sodium
Manganese
Manganese
Selenium
Selenium
251%
293%
41%
546%
1361%
211%
270%
1.4%
321%
188%
Vitamin Comparison
Vitamin comparison score is based on the number of vitamins by which one or the other food is richer. The "coverage" charts below show how much of the daily needs can be covered by 300 grams of the food.
3
100 g
300 g
1 oz, dry, yields - 177g 1 packet, dry, yields - 177g 1 cup, cooked - 234g 1 cup, dry, yields - 501g
Vitamin C
Vit. C
Vitamin D
Vit. D
Vitamin A
Vit. A
Vitamin E
Vit. E
Vitamin B1
Vit. B1
Vitamin B2
Vit. B2
Vitamin B3
Vit. B3
Vitamin B5
Vit. B5
Vitamin B6
Vit. B6
Vitamin B12
Vit. B12
Vitamin K
Vit. K
Folate
Folate
0%
0%
43%
1.4%
65%
50%
57%
19%
67%
0%
1%
33%
6
100 g
300 g
1 tbsp - 9g 1 cup - 144g
Vitamin C
Vit. C
Vitamin D
Vit. D
Vitamin A
Vit. A
Vitamin E
Vit. E
Vitamin B1
Vit. B1
Vitamin B2
Vit. B2
Vitamin B3
Vit. B3
Vitamin B5
Vit. B5
Vitamin B6
Vit. B6
Vitamin B12
Vit. B12
Vitamin K
Vit. K
Folate
Folate
0%
0%
0%
5%
198%
57%
85%
3%
182%
0%
0%
73%
All nutrients comparison - raw data values
Nutrient
DV% diff.
Copper
0.066mg
4.082mg
446%
Polyunsaturated fat
0.426g
21.773g
142%
Iron
5.96mg
14.55mg
107%
Calcium
80mg
975mg
90%
Manganese
0.558mg
2.46mg
83%
Phosphorus
77mg
629mg
79%
Magnesium
26mg
351mg
77%
Fats
1.36g
49.67g
74%
Zinc
0.62mg
7.75mg
65%
Selenium
5µg
34.4µg
53%
Monounsaturated fat
0.391g
18.759g
46%
Vitamin B1
0.26mg
0.791mg
44%
Fiber
1.7g
11.8g
40%
Vitamin B6
0.29mg
0.79mg
38%
Protein
2.37g
17.73g
31%
Saturated fat
0.226g
6.957g
31%
Calories
68kcal
573kcal
25%
Vitamin A
130µg
0µg
14%
Folate
44µg
97µg
13%
Potassium
61mg
468mg
12%
Vitamin B3
3.025mg
4.515mg
9%
Vitamin B5
0.317mg
0.05mg
5%
Carbs
11.67g
23.45g
4%
Starch
10.37g
4%
Choline
4.7mg
25.6mg
4%
Sodium
49mg
11mg
2%
Vitamin B2
0.215mg
0.247mg
2%
Vitamin E
0.07mg
0.25mg
1%
Protein per 100 calories
3.5g
3.1g
N/A
Calories per 10 g protein
287kcal
323kcal
N/A
Weight per 100 calories
147g
17g
N/A
Unsaturated / Saturated Fat ratio
3.6
5.8
N/A
Net carbs
9.97g
11.65g
N/A
Sugar
0.46g
0.3g
N/A
Vitamin K
0.4µg
0µg
0%
Trans fat
0.003g
N/A
Tryptophan
0.04mg
0.388mg
0%
Threonine
0.083mg
0.736mg
0%
Isoleucine
0.105mg
0.763mg
0%
Leucine
0.2mg
1.358mg
0%
Lysine
0.135mg
0.569mg
0%
Methionine
0.04mg
0.586mg
0%
Phenylalanine
0.13mg
0.94mg
0%
Valine
0.151mg
0.99mg
0%
Histidine
0.057mg
0.522mg
0%
Macronutrient Comparison
Macronutrient breakdown side-by-side comparison
1
2%
12%
84%
Protein:
2.37 g
Fats:
1.36 g
Carbs:
11.67 g
Water:
84.03 g
Other:
0.57 g
4
18%
50%
23%
5%
4%
Protein:
17.73 g
Fats:
49.67 g
Carbs:
23.45 g
Water:
4.69 g
Other:
4.46 g
Contains
more
Water Water
+1691.7%
Contains
more
Protein Protein
+648.1%
Contains
more
Fats Fats
+3552.2%
Contains
more
Carbs Carbs
+100.9%
Contains
more
Other Other
+682.5%
Fat Type Comparison
Fat type breakdown side-by-side comparison
1
22%
37%
41%
Saturated fat:
Sat. Fat
0.226 g
Monounsaturated fat:
Mono. Fat
0.391 g
Polyunsaturated fat:
Poly. Fat
0.426 g
2
15%
40%
46%
Saturated fat:
Sat. Fat
6.957 g
Monounsaturated fat:
Mono. Fat
18.759 g
Polyunsaturated fat:
Poly. Fat
21.773 g
Contains
less
Sat. Fat Saturated fat
-96.8%
Contains
more
Mono. Fat Monounsaturated fat
+4697.7%
Contains
more
Poly. Fat Polyunsaturated fat
+5011%