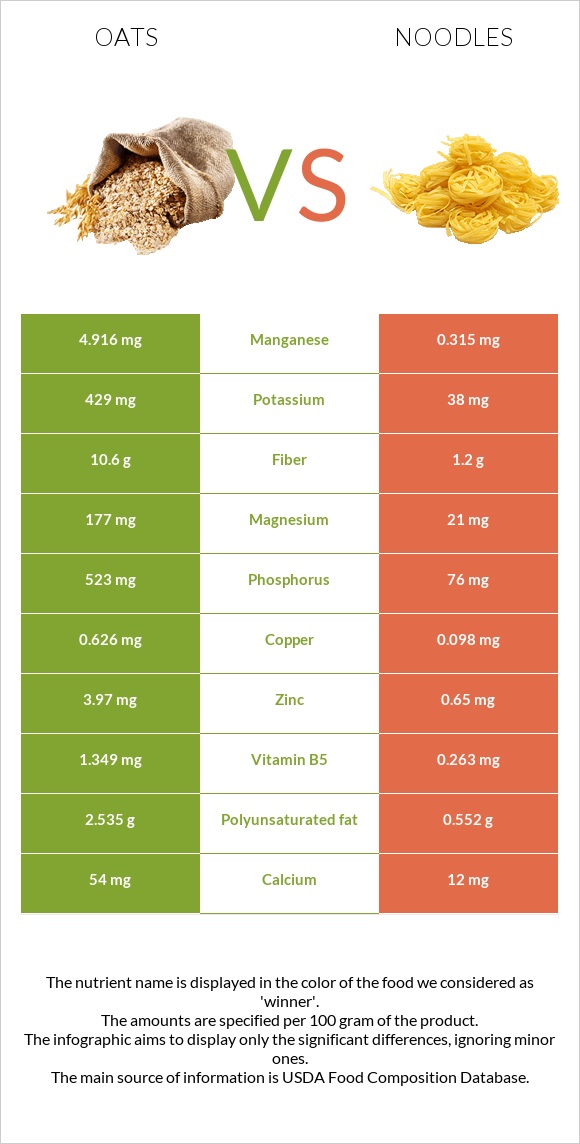
How are oats and noodles different? Oats are higher than noodles in manganese, phosphorus, copper, iron, vitamin B1, fiber, magnesium, zinc, vitamin B5, and potassium. Oats cover your daily need for manganese, 200% more than noodles. Oats contain 11 times more potassium than noodles. Oats contain 429mg of potassium, while noodles contains 38mg. Oats and Noodles, egg, enriched, cooked types were used in this article.
Infographic
Mineral Comparison
Mineral comparison score is based on the number of minerals by which one or the other food is richer. The "coverage" charts below show how much of the daily needs can be covered by 300 grams of the food.
9
100 g
300 g
1 cup - 156g
Magnesium
Magnesium
Calcium
Calcium
Potassium
Potassium
Iron
Iron
Copper
Copper
Zinc
Zinc
Phosphorus
Phosphorus
Sodium
Sodium
Manganese
Manganese
Selenium
Selenium
126%
16%
38%
177%
209%
108%
224%
0.26%
641%
0%
1
100 g
300 g
1 cup - 160g
Magnesium
Magnesium
Calcium
Calcium
Potassium
Potassium
Iron
Iron
Copper
Copper
Zinc
Zinc
Phosphorus
Phosphorus
Sodium
Sodium
Manganese
Manganese
Selenium
Selenium
15%
3.6%
3.4%
55%
33%
18%
33%
0.65%
41%
130%
Vitamin Comparison
Vitamin comparison score is based on the number of vitamins by which one or the other food is richer. The "coverage" charts below show how much of the daily needs can be covered by 300 grams of the food.
3
100 g
300 g
1 cup - 156g
Vitamin C
Vit. C
Vitamin D
Vit. D
Vitamin A
Vit. A
Vitamin E
Vit. E
Vitamin B1
Vit. B1
Vitamin B2
Vit. B2
Vitamin B3
Vit. B3
Vitamin B5
Vit. B5
Vitamin B6
Vit. B6
Vitamin B12
Vit. B12
Vitamin K
Vit. K
Folate
Folate
0%
0%
0%
0%
191%
32%
18%
81%
27%
0%
0%
42%
6
100 g
300 g
1 cup - 160g
Vitamin C
Vit. C
Vitamin D
Vit. D
Vitamin A
Vit. A
Vitamin E
Vit. E
Vitamin B1
Vit. B1
Vitamin B2
Vit. B2
Vitamin B3
Vit. B3
Vitamin B5
Vit. B5
Vitamin B6
Vit. B6
Vitamin B12
Vit. B12
Vitamin K
Vit. K
Folate
Folate
0%
1.5%
2%
3.4%
72%
31%
39%
16%
11%
11%
0%
63%
All nutrients comparison - raw data values
Nutrient
DV% diff.
Manganese
4.916mg
0.315mg
200%
Phosphorus
523mg
76mg
64%
Copper
0.626mg
0.098mg
59%
Selenium
23.9µg
43%
Iron
4.72mg
1.47mg
41%
Vitamin B1
0.763mg
0.289mg
40%
Fiber
10.6g
1.2g
38%
Magnesium
177mg
21mg
37%
Zinc
3.97mg
0.65mg
30%
Protein
16.89g
4.54g
25%
Vitamin B5
1.349mg
0.263mg
22%
Carbs
66.27g
25.16g
14%
Calories
389kcal
138kcal
13%
Polyunsaturated fat
2.535g
0.552g
13%
Potassium
429mg
38mg
12%
Cholesterol
0mg
29mg
10%
Fats
6.9g
2.07g
7%
Vitamin B3
0.961mg
2.077mg
7%
Folate
56µg
84µg
7%
Vitamin B6
0.119mg
0.046mg
6%
Choline
25.7mg
5%
Calcium
54mg
12mg
4%
Vitamin B12
0µg
0.09µg
4%
Saturated fat
1.217g
0.419g
4%
Monounsaturated fat
2.178g
0.581g
4%
Vitamin D*
0 IU
4 IU
1%
Vitamin D
0µg
0.1µg
1%
Vitamin A
0µg
6µg
1%
Vitamin E
0.17mg
1%
Protein per 100 calories
4.3g
3.3g
N/A
Calories per 10 g protein
230kcal
304kcal
N/A
Weight per 100 calories
26g
72g
N/A
Unsaturated / Saturated Fat ratio
3.9
2.7
N/A
Net carbs
55.67g
23.96g
N/A
Sugar
0.4g
N/A
Sodium
2mg
5mg
0%
Vitamin B2
0.139mg
0.136mg
0%
Trans fat
0.029g
N/A
Tryptophan
0.234mg
0.043mg
0%
Threonine
0.575mg
0.138mg
0%
Isoleucine
0.694mg
0.19mg
0%
Leucine
1.284mg
0.365mg
0%
Lysine
0.701mg
0.137mg
0%
Methionine
0.312mg
0.086mg
0%
Phenylalanine
0.895mg
0.24mg
0%
Valine
0.937mg
0.22mg
0%
Histidine
0.405mg
0.121mg
0%
Macronutrient Comparison
Macronutrient breakdown side-by-side comparison
4
17%
7%
66%
8%
2%
Protein:
16.89 g
Fats:
6.9 g
Carbs:
66.27 g
Water:
8.22 g
Other:
1.72 g
1
5%
2%
25%
68%
Protein:
4.54 g
Fats:
2.07 g
Carbs:
25.16 g
Water:
67.73 g
Other:
0.5 g
Contains
more
Protein Protein
+272%
Contains
more
Fats Fats
+233.3%
Contains
more
Carbs Carbs
+163.4%
Contains
more
Other Other
+244%
Contains
more
Water Water
+724%
Fat Type Comparison
Fat type breakdown side-by-side comparison
2
21%
37%
43%
Saturated fat:
Sat. Fat
1.217 g
Monounsaturated fat:
Mono. Fat
2.178 g
Polyunsaturated fat:
Poly. Fat
2.535 g
1
27%
37%
36%
Saturated fat:
Sat. Fat
0.419 g
Monounsaturated fat:
Mono. Fat
0.581 g
Polyunsaturated fat:
Poly. Fat
0.552 g
Contains
more
Mono. Fat Monounsaturated fat
+274.9%
Contains
more
Poly. Fat Polyunsaturated fat
+359.2%
Contains
less
Sat. Fat Saturated fat
-65.6%