Octopus vs. Milkfish — In-Depth Nutrition Comparison
Compare
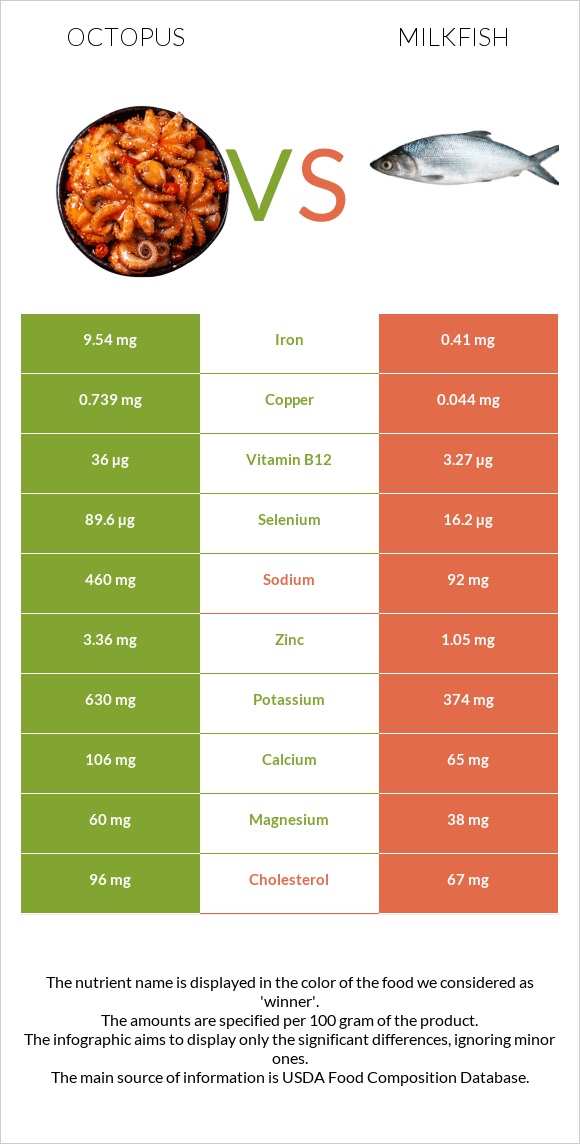
Important differences between octopus and milkfish
- Octopus has more vitamin B12, selenium, iron, copper, zinc, vitamin B6, and phosphorus; however, milkfish is richer in vitamin B3.
- Octopus's daily need coverage for vitamin B12 is 1364% more.
- Octopus contains 23 times more iron than milkfish. Octopus contains 9.54mg of iron, while milkfish contains 0.41mg.
- Milkfish contains less sodium.
The food varieties used in the comparison are Mollusks, octopus, common, cooked, moist heat and Fish, milkfish, cooked, dry heat.
Infographic
Infographic link
Mineral Comparison
Mineral comparison score is based on the number of minerals by which one or the other food is richer. The "coverage" charts below show how much of the daily needs can be covered by 300 grams of the food.
| Contains more MagnesiumMagnesium | +57.9% |
| Contains more CalciumCalcium | +63.1% |
| Contains more PotassiumPotassium | +68.4% |
| Contains more IronIron | +2226.8% |
| Contains more CopperCopper | +1579.5% |
| Contains more ZincZinc | +220% |
| Contains more PhosphorusPhosphorus | +34.1% |
| Contains more ManganeseManganese | +80.8% |
| Contains more SeleniumSelenium | +453.1% |
| Contains less SodiumSodium | -80% |
Vitamin Comparison
Vitamin comparison score is based on the number of vitamins by which one or the other food is richer. The "coverage" charts below show how much of the daily needs can be covered by 300 grams of the food.
| Contains more Vitamin CVitamin C | +∞% |
| Contains more Vitamin AVitamin A | +172.7% |
| Contains more Vitamin EVitamin E | +∞% |
| Contains more Vitamin B1Vitamin B1 | +256.3% |
| Contains more Vitamin B6Vitamin B6 | +32.8% |
| Contains more Vitamin B12Vitamin B12 | +1000.9% |
| Contains more Vitamin KVitamin K | +∞% |
| Contains more FolateFolate | +33.3% |
| Contains more Vitamin B3Vitamin B3 | +118.4% |
All nutrients comparison - raw data values
| Nutrient |  |
 |
DV% diff. |
| Vitamin B12 | 36µg | 3.27µg | 1364% |
| Selenium | 89.6µg | 16.2µg | 133% |
| Iron | 9.54mg | 0.41mg | 114% |
| Copper | 0.739mg | 0.044mg | 77% |
| Vitamin B3 | 3.78mg | 8.256mg | 28% |
| Zinc | 3.36mg | 1.05mg | 21% |
| Sodium | 460mg | 92mg | 16% |
| Choline | 81mg | 15% | |
| Vitamin B6 | 0.648mg | 0.488mg | 12% |
| Fats | 2.08g | 8.63g | 10% |
| Cholesterol | 96mg | 67mg | 10% |
| Phosphorus | 279mg | 208mg | 10% |
| Vitamin C | 8mg | 0mg | 9% |
| Potassium | 630mg | 374mg | 8% |
| Vitamin E | 1.2mg | 8% | |
| Protein | 29.82g | 26.32g | 7% |
| Vitamin A | 90µg | 33µg | 6% |
| Magnesium | 60mg | 38mg | 5% |
| Calcium | 106mg | 65mg | 4% |
| Vitamin B1 | 0.057mg | 0.016mg | 3% |
| Polyunsaturated fat | 0.477g | 3% | |
| Folate | 24µg | 18µg | 2% |
| Saturated fat | 0.453g | 2% | |
| Calories | 164kcal | 190kcal | 1% |
| Carbs | 4.4g | 0g | 1% |
| Manganese | 0.047mg | 0.026mg | 1% |
| Vitamin B2 | 0.076mg | 0.069mg | 1% |
| Vitamin B5 | 0.9mg | 0.865mg | 1% |
| Monounsaturated fat | 0.324g | 1% | |
| Net carbs | 4.4g | 0g | N/A |
| Vitamin K | 0.1µg | 0% | |
| Tryptophan | 0.334mg | 0.295mg | 0% |
| Threonine | 1.283mg | 1.154mg | 0% |
| Isoleucine | 1.298mg | 1.213mg | 0% |
| Leucine | 2.099mg | 2.139mg | 0% |
| Lysine | 2.228mg | 2.417mg | 0% |
| Methionine | 0.673mg | 0.779mg | 0% |
| Phenylalanine | 1.069mg | 1.028mg | 0% |
| Valine | 1.303mg | 1.356mg | 0% |
| Histidine | 0.573mg | 0.775mg | 0% |
| Omega-3 - EPA | 0.152g | N/A | |
| Omega-3 - DHA | 0.162g | N/A | |
| Omega-3 - DPA | 0.012g | N/A |
Macronutrient Comparison
Macronutrient breakdown side-by-side comparison
| Contains more ProteinProtein | +13.3% |
| Contains more CarbsCarbs | +∞% |
| Contains more OtherOther | +32.2% |
| Contains more FatsFats | +314.9% |
~equal in
Water
~62.63g


