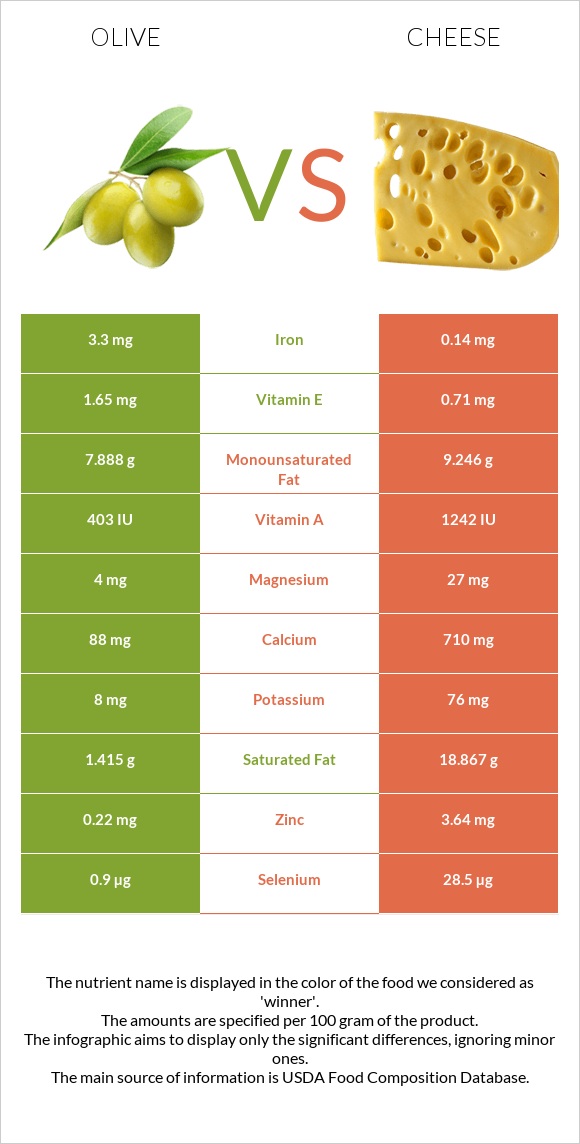
Important differences between olive and cheese Olive has more iron and copper; however, cheese has more phosphorus, calcium, selenium, vitamin B12, vitamin B2, and zinc. Cheese's daily need coverage for saturated fat is 87% more. Olive has 24 times more iron than cheese. Olive has 3.3mg of iron, while cheese has 0.14mg. Olive is lower in saturated fat. The food varieties used in the comparison are Olives, ripe, canned (small-extra large) and Cheese, cheddar .
Infographic
Mineral Comparison
Mineral comparison score is based on the number of minerals by which one or the other food is richer. The "coverage" charts below show how much of the daily needs can be covered by 300 grams of the food.
2
100 g
300 g
1 small - 3.2g 1 large - 4.4g 1 tbsp - 8.4g
Magnesium
Magnesium
Calcium
Calcium
Potassium
Potassium
Iron
Iron
Copper
Copper
Zinc
Zinc
Phosphorus
Phosphorus
Sodium
Sodium
Manganese
Manganese
Selenium
Selenium
2.9%
26%
0.71%
124%
84%
6%
1.3%
96%
2.6%
4.9%
8
100 g
300 g
1 cubic inch - 17g 1 slice (1 oz) - 28g 1 oz - 28.35g 1 cup, shredded - 113g 1 cup, diced - 132g 1 cup, melted - 244g
Magnesium
Magnesium
Calcium
Calcium
Potassium
Potassium
Iron
Iron
Copper
Copper
Zinc
Zinc
Phosphorus
Phosphorus
Sodium
Sodium
Manganese
Manganese
Selenium
Selenium
19%
213%
6.7%
5.3%
10%
99%
195%
85%
3.5%
155%
Vitamin Comparison
Vitamin comparison score is based on the number of vitamins by which one or the other food is richer. The "coverage" charts below show how much of the daily needs can be covered by 300 grams of the food.
2
100 g
300 g
1 small - 3.2g 1 large - 4.4g 1 tbsp - 8.4g
Vitamin C
Vit. C
Vitamin D
Vit. D
Vitamin A
Vit. A
Vitamin E
Vit. E
Vitamin B1
Vit. B1
Vitamin B2
Vit. B2
Vitamin B3
Vit. B3
Vitamin B5
Vit. B5
Vitamin B6
Vit. B6
Vitamin B12
Vit. B12
Vitamin K
Vit. K
Folate
Folate
3%
0%
6.7%
33%
0.75%
0%
0.69%
0.9%
2.1%
0%
3.5%
0%
10
100 g
300 g
1 cubic inch - 17g 1 slice (1 oz) - 28g 1 oz - 28.35g 1 cup, shredded - 113g 1 cup, diced - 132g 1 cup, melted - 244g
Vitamin C
Vit. C
Vitamin D
Vit. D
Vitamin A
Vit. A
Vitamin E
Vit. E
Vitamin B1
Vit. B1
Vitamin B2
Vit. B2
Vitamin B3
Vit. B3
Vitamin B5
Vit. B5
Vitamin B6
Vit. B6
Vitamin B12
Vit. B12
Vitamin K
Vit. K
Folate
Folate
0%
9%
110%
14%
7.3%
99%
1.1%
25%
15%
138%
6%
20%
All nutrients comparison - raw data values
Nutrient
DV% diff.
Saturated fat
1.415g
18.867g
79%
Phosphorus
3mg
455mg
65%
Calcium
88mg
710mg
62%
Selenium
0.9µg
28.5µg
50%
Vitamin B12
0µg
1.1µg
46%
Protein
0.84g
22.87g
44%
Iron
3.3mg
0.14mg
40%
Fats
10.68g
33.31g
35%
Vitamin A
20µg
330µg
34%
Cholesterol
0mg
99mg
33%
Vitamin B2
0mg
0.428mg
33%
Zinc
0.22mg
3.64mg
31%
Copper
0.251mg
0.03mg
25%
Calories
115kcal
404kcal
14%
Fiber
3.2g
0g
13%
Vitamin B5
0.015mg
0.41mg
8%
Folate
0µg
27µg
7%
Vitamin E
1.65mg
0.71mg
6%
Magnesium
4mg
27mg
5%
Sodium
735mg
653mg
4%
Vitamin B6
0.009mg
0.066mg
4%
Vitamin D*
0 IU
24 IU
3%
Vitamin D
0µg
0.6µg
3%
Monounsaturated fat
7.888g
9.246g
3%
Polyunsaturated fat
0.911g
1.421g
3%
Potassium
8mg
76mg
2%
Vitamin B1
0.003mg
0.029mg
2%
Vitamin C
0.9mg
0mg
1%
Carbs
6.26g
3.09g
1%
Vitamin K
1.4µg
2.4µg
1%
Choline
10.3mg
16.5mg
1%
Protein per 100 calories
0.73g
5.7g
N/A
Calories per 10 g protein
1369kcal
177kcal
N/A
Weight per 100 calories
87g
25g
N/A
Unsaturated / Saturated Fat ratio
6.2
0.57
N/A
Net carbs
3.06g
3.09g
N/A
Sugar
0g
0.48g
N/A
Manganese
0.02mg
0.027mg
0%
Vitamin B3
0.037mg
0.059mg
0%
Trans fat
0g
0.917g
N/A
Tryptophan
0.547mg
0%
Threonine
0.026mg
1.044mg
0%
Isoleucine
0.031mg
1.206mg
0%
Leucine
0.05mg
1.939mg
0%
Lysine
0.032mg
1.025mg
0%
Methionine
0.012mg
0.547mg
0%
Phenylalanine
0.029mg
1.074mg
0%
Valine
0.038mg
1.404mg
0%
Histidine
0.023mg
0.547mg
0%
Omega-3 - EPA
0g
0.01g
N/A
Omega-3 - DHA
0g
0.001g
N/A
Omega-3 - DPA
0g
0.017g
N/A
Omega-6 - Eicosadienoic acid
0.007g
N/A
Macronutrient Comparison
Macronutrient breakdown side-by-side comparison
2
11%
6%
80%
2%
Protein:
0.84 g
Fats:
10.68 g
Carbs:
6.26 g
Water:
79.99 g
Other:
2.23 g
3
23%
33%
3%
37%
4%
Protein:
22.87 g
Fats:
33.31 g
Carbs:
3.09 g
Water:
37.02 g
Other:
3.71 g
Contains
more
Carbs Carbs
+102.6%
Contains
more
Water Water
+116.1%
Contains
more
Protein Protein
+2622.6%
Contains
more
Fats Fats
+211.9%
Contains
more
Other Other
+66.4%
Fat Type Comparison
Fat type breakdown side-by-side comparison
1
14%
77%
9%
Saturated fat:
Sat. Fat
1.415 g
Monounsaturated fat:
Mono. Fat
7.888 g
Polyunsaturated fat:
Poly. Fat
0.911 g
2
64%
31%
5%
Saturated fat:
Sat. Fat
18.867 g
Monounsaturated fat:
Mono. Fat
9.246 g
Polyunsaturated fat:
Poly. Fat
1.421 g
Contains
less
Sat. Fat Saturated fat
-92.5%
Contains
more
Mono. Fat Monounsaturated fat
+17.2%
Contains
more
Poly. Fat Polyunsaturated fat
+56%