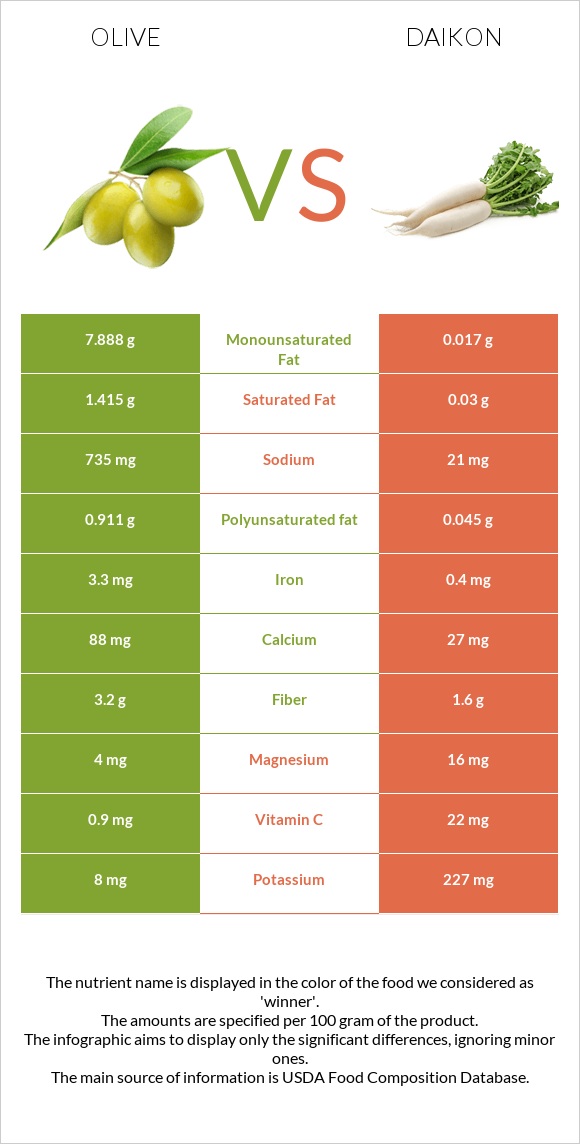
Summary of differences between olive and daikon Olive has more iron, copper, vitamin E, vitamin A, and fiber, while daikon has more vitamin C, folate, and potassium. Olive covers your daily need for iron, 36% more than daikon. The amount of saturated fat in daikon is lower. These are the specific foods used in this comparison Olives, ripe, canned (small-extra large) and Radishes, oriental, raw .
Infographic
Mineral Comparison
Mineral comparison score is based on the number of minerals by which one or the other food is richer. The "coverage" charts below show how much of the daily needs can be covered by 300 grams of the food.
5
100 g
300 g
1 small - 3.2g 1 large - 4.4g 1 tbsp - 8.4g
Magnesium
Magnesium
Calcium
Calcium
Potassium
Potassium
Iron
Iron
Copper
Copper
Zinc
Zinc
Phosphorus
Phosphorus
Sodium
Sodium
Manganese
Manganese
Selenium
Selenium
2.9%
26%
0.71%
124%
84%
6%
1.3%
96%
2.6%
4.9%
5
100 g
300 g
1 cup slices - 116g 1 radish (7" long) - 338g
Magnesium
Magnesium
Calcium
Calcium
Potassium
Potassium
Iron
Iron
Copper
Copper
Zinc
Zinc
Phosphorus
Phosphorus
Sodium
Sodium
Manganese
Manganese
Selenium
Selenium
11%
8.1%
20%
15%
38%
4.1%
9.9%
2.7%
5%
3.8%
Vitamin Comparison
Vitamin comparison score is based on the number of vitamins by which one or the other food is richer. The "coverage" charts below show how much of the daily needs can be covered by 300 grams of the food.
3
100 g
300 g
1 small - 3.2g 1 large - 4.4g 1 tbsp - 8.4g
Vitamin C
Vit. C
Vitamin D
Vit. D
Vitamin A
Vit. A
Vitamin E
Vit. E
Vitamin B1
Vit. B1
Vitamin B2
Vit. B2
Vitamin B3
Vit. B3
Vitamin B5
Vit. B5
Vitamin B6
Vit. B6
Vitamin B12
Vit. B12
Vitamin K
Vit. K
Folate
Folate
3%
0%
6.7%
33%
0.75%
0%
0.69%
0.9%
2.1%
0%
3.5%
0%
7
100 g
300 g
1 cup slices - 116g 1 radish (7" long) - 338g
Vitamin C
Vit. C
Vitamin D
Vit. D
Vitamin A
Vit. A
Vitamin E
Vit. E
Vitamin B1
Vit. B1
Vitamin B2
Vit. B2
Vitamin B3
Vit. B3
Vitamin B5
Vit. B5
Vitamin B6
Vit. B6
Vitamin B12
Vit. B12
Vitamin K
Vit. K
Folate
Folate
73%
0%
0%
0%
5%
4.6%
3.8%
8.3%
11%
0%
0.75%
21%
All nutrients comparison - raw data values
Nutrient
DV% diff.
Iron
3.3mg
0.4mg
36%
Sodium
735mg
21mg
31%
Vitamin C
0.9mg
22mg
23%
Monounsaturated fat
7.888g
0.017g
20%
Fats
10.68g
0.1g
16%
Copper
0.251mg
0.115mg
15%
Vitamin E
1.65mg
0mg
11%
Folate
0µg
28µg
7%
Calcium
88mg
27mg
6%
Potassium
8mg
227mg
6%
Fiber
3.2g
1.6g
6%
Saturated fat
1.415g
0.03g
6%
Polyunsaturated fat
0.911g
0.045g
6%
Calories
115kcal
18kcal
5%
Magnesium
4mg
16mg
3%
Phosphorus
3mg
23mg
3%
Vitamin B6
0.009mg
0.046mg
3%
Vitamin A
20µg
0µg
2%
Vitamin B2
0mg
0.02mg
2%
Vitamin B5
0.015mg
0.138mg
2%
Carbs
6.26g
4.1g
1%
Zinc
0.22mg
0.15mg
1%
Manganese
0.02mg
0.038mg
1%
Vitamin B1
0.003mg
0.02mg
1%
Vitamin B3
0.037mg
0.2mg
1%
Vitamin K
1.4µg
0.3µg
1%
Choline
10.3mg
7.3mg
1%
Protein
0.84g
0.6g
0%
Protein per 100 calories
0.73g
3.3g
N/A
Calories per 10 g protein
1369kcal
300kcal
N/A
Weight per 100 calories
87g
556g
N/A
Unsaturated / Saturated Fat ratio
6.2
2.1
N/A
Net carbs
3.06g
2.5g
N/A
Sugar
0g
2.5g
N/A
Selenium
0.9µg
0.7µg
0%
Tryptophan
0.003mg
0%
Threonine
0.026mg
0.025mg
0%
Isoleucine
0.031mg
0.026mg
0%
Leucine
0.05mg
0.031mg
0%
Lysine
0.032mg
0.03mg
0%
Methionine
0.012mg
0.006mg
0%
Phenylalanine
0.029mg
0.02mg
0%
Valine
0.038mg
0.028mg
0%
Histidine
0.023mg
0.011mg
0%
Macronutrient Comparison
Macronutrient breakdown side-by-side comparison
4
11%
6%
80%
2%
Protein:
0.84 g
Fats:
10.68 g
Carbs:
6.26 g
Water:
79.99 g
Other:
2.23 g
1
4%
95%
Protein:
0.6 g
Fats:
0.1 g
Carbs:
4.1 g
Water:
94.62 g
Other:
0.58 g
Contains
more
Protein Protein
+40%
Contains
more
Fats Fats
+10580%
Contains
more
Carbs Carbs
+52.7%
Contains
more
Other Other
+284.5%
Contains
more
Water Water
+18.3%
Fat Type Comparison
Fat type breakdown side-by-side comparison
2
14%
77%
9%
Saturated fat:
Sat. Fat
1.415 g
Monounsaturated fat:
Mono. Fat
7.888 g
Polyunsaturated fat:
Poly. Fat
0.911 g
1
33%
18%
49%
Saturated fat:
Sat. Fat
0.03 g
Monounsaturated fat:
Mono. Fat
0.017 g
Polyunsaturated fat:
Poly. Fat
0.045 g
Contains
more
Mono. Fat Monounsaturated fat
+46300%
Contains
more
Poly. Fat Polyunsaturated fat
+1924.4%
Contains
less
Sat. Fat Saturated fat
-97.9%