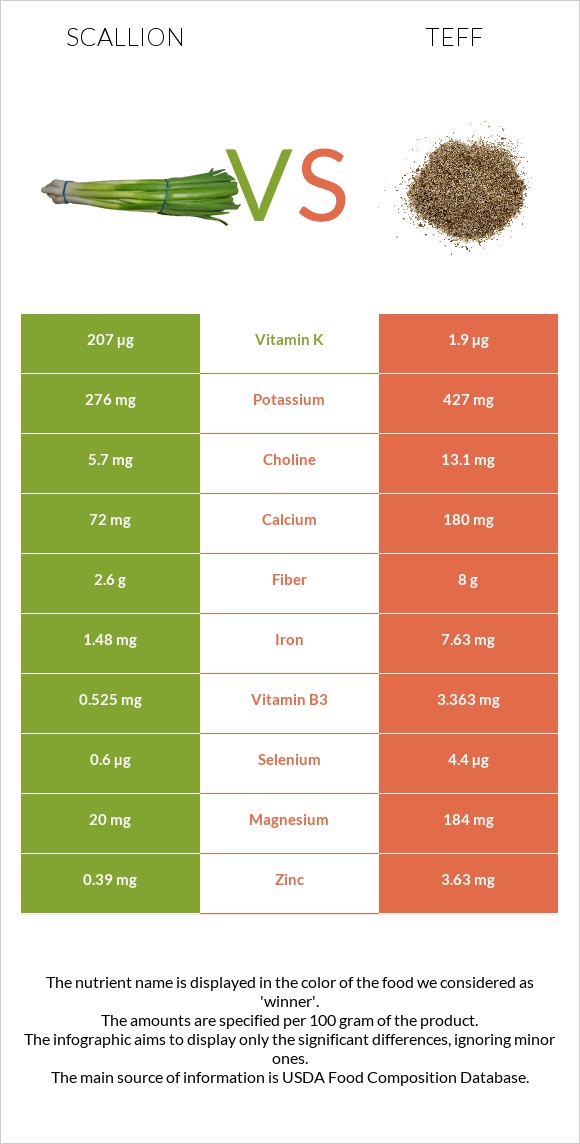
The main differences between scallions and teff Scallions have more vitamin A and folate; however, teff has more manganese, copper, phosphorus, vitamin B1, magnesium, iron, and zinc. Daily need coverage for manganese for teff is 117% higher. Teff has 499 times less vitamin A than scallions. Scallions have 997 IU of vitamin A, while teff has 2 IU. Teff has a higher glycemic index than scallions. Food types used in this article are Onions, spring or scallions (includes tops and bulb), raw and Teff, cooked .
Infographic
Mineral Comparison
Mineral comparison score is based on the number of minerals by which one or the other food is richer. The "coverage" charts below show how much of the daily needs can be covered by 300 grams of the food.
3
100 g
300 g
1 small (3" long) - 5g 1 tbsp chopped - 6g 1 medium (4-1/8" long) - 15g 1 large - 25g
Magnesium
Magnesium
Calcium
Calcium
Potassium
Potassium
Iron
Iron
Copper
Copper
Zinc
Zinc
Phosphorus
Phosphorus
Sodium
Sodium
Manganese
Manganese
Selenium
Selenium
14%
22%
24%
56%
28%
11%
16%
2.1%
21%
3.3%
7
100 g
300 g
1 cup - 252g
Magnesium
Magnesium
Calcium
Calcium
Potassium
Potassium
Iron
Iron
Copper
Copper
Zinc
Zinc
Phosphorus
Phosphorus
Sodium
Sodium
Manganese
Manganese
Selenium
Selenium
36%
15%
9.4%
77%
75%
30%
51%
1%
373%
0%
Vitamin Comparison
Vitamin comparison score is based on the number of vitamins by which one or the other food is richer. The "coverage" charts below show how much of the daily needs can be covered by 300 grams of the food.
7
100 g
300 g
1 small (3" long) - 5g 1 tbsp chopped - 6g 1 medium (4-1/8" long) - 15g 1 large - 25g
Vitamin C
Vit. C
Vitamin D
Vit. D
Vitamin A
Vit. A
Vitamin E
Vit. E
Vitamin B1
Vit. B1
Vitamin B2
Vit. B2
Vitamin B3
Vit. B3
Vitamin B5
Vit. B5
Vitamin B6
Vit. B6
Vitamin B12
Vit. B12
Vitamin K
Vit. K
Folate
Folate
63%
0%
17%
11%
14%
18%
9.8%
4.5%
14%
0%
518%
48%
3
100 g
300 g
1 cup - 252g
Vitamin C
Vit. C
Vitamin D
Vit. D
Vitamin A
Vit. A
Vitamin E
Vit. E
Vitamin B1
Vit. B1
Vitamin B2
Vit. B2
Vitamin B3
Vit. B3
Vitamin B5
Vit. B5
Vitamin B6
Vit. B6
Vitamin B12
Vit. B12
Vitamin K
Vit. K
Folate
Folate
0%
0%
0%
0%
46%
7.6%
17%
0%
22%
0%
0%
14%
All nutrients comparison - raw data values
Nutrient
DV% diff.
Vitamin K
207µg
173%
Manganese
0.16mg
2.86mg
117%
Vitamin C
18.8mg
21%
Copper
0.083mg
0.226mg
16%
Phosphorus
37mg
120mg
12%
Folate
64µg
18µg
12%
Vitamin B1
0.055mg
0.183mg
11%
Magnesium
20mg
50mg
7%
Iron
1.48mg
2.05mg
7%
Zinc
0.39mg
1.11mg
7%
Vitamin A
50µg
0µg
6%
Potassium
276mg
107mg
5%
Protein
1.83g
3.87g
4%
Carbs
7.34g
19.86g
4%
Vitamin E
0.55mg
4%
Vitamin B2
0.08mg
0.033mg
4%
Calories
32kcal
101kcal
3%
Vitamin B6
0.061mg
0.097mg
3%
Calcium
72mg
49mg
2%
Vitamin B3
0.525mg
0.909mg
2%
Vitamin B5
0.075mg
2%
Fats
0.19g
0.65g
1%
Fiber
2.6g
2.8g
1%
Selenium
0.6µg
1%
Choline
5.7mg
1%
Protein per 100 calories
5.7g
3.8g
N/A
Calories per 10 g protein
175kcal
261kcal
N/A
Weight per 100 calories
313g
99g
N/A
Net carbs
4.74g
17.06g
N/A
Sugar
2.33g
N/A
Sodium
16mg
8mg
0%
Saturated fat
0.032g
0%
Monounsaturated fat
0.027g
0%
Polyunsaturated fat
0.074g
0%
Tryptophan
0.02mg
0.041mg
0%
Threonine
0.072mg
0.149mg
0%
Isoleucine
0.077mg
0.146mg
0%
Leucine
0.109mg
0.311mg
0%
Lysine
0.091mg
0.109mg
0%
Methionine
0.02mg
0.125mg
0%
Phenylalanine
0.059mg
0.203mg
0%
Valine
0.081mg
0.2mg
0%
Histidine
0.032mg
0.088mg
0%
Macronutrient Comparison
Macronutrient breakdown side-by-side comparison
2
2%
7%
90%
Protein:
1.83 g
Fats:
0.19 g
Carbs:
7.34 g
Water:
89.83 g
Other:
0.81 g
3
4%
20%
75%
Protein:
3.87 g
Fats:
0.65 g
Carbs:
19.86 g
Water:
74.93 g
Other:
0.69 g
Contains
more
Water Water
+19.9%
Contains
more
Other Other
+17.4%
Contains
more
Protein Protein
+111.5%
Contains
more
Fats Fats
+242.1%
Contains
more
Carbs Carbs
+170.6%