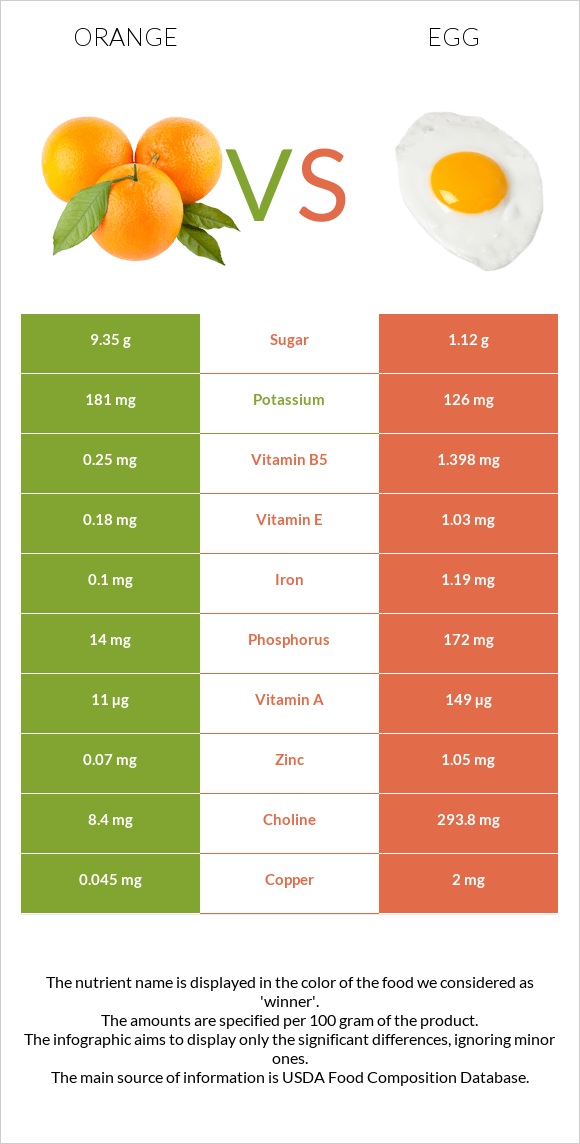
How are oranges and eggs different? Oranges are higher in vitamin C; however, eggs are richer in copper, selenium, choline, vitamin B12, vitamin B2, vitamin B5, and phosphorus. Daily need coverage for copper for eggs is 217% higher. Oranges have less saturated fat. Eggs have a lower glycemic index (0) than oranges (45). Oranges, raw, all commercial varieties and Egg, whole, cooked, hard-boiled are the varieties used in this article.
Infographic
Mineral Comparison
Mineral comparison score is based on the number of minerals by which one or the other food is richer. The "coverage" charts below show how much of the daily needs can be covered by 300 grams of the food.
2
100 g
300 g
1 small (2-3/8" dia) - 96g 1 fruit (2-5/8" dia) - 131g 1 cup, sections - 180g 1 large (3-1/16" dia) - 184g
Magnesium
Magnesium
Calcium
Calcium
Potassium
Potassium
Iron
Iron
Copper
Copper
Zinc
Zinc
Phosphorus
Phosphorus
Sodium
Sodium
Manganese
Manganese
Selenium
Selenium
7.1%
12%
16%
3.8%
15%
1.9%
6%
0%
3.3%
2.7%
6
100 g
300 g
1 tbsp - 8.5g 1 large - 50g 1 cup, chopped - 136g
Magnesium
Magnesium
Calcium
Calcium
Potassium
Potassium
Iron
Iron
Copper
Copper
Zinc
Zinc
Phosphorus
Phosphorus
Sodium
Sodium
Manganese
Manganese
Selenium
Selenium
7.1%
15%
11%
45%
667%
29%
74%
16%
3.4%
168%
Vitamin Comparison
Vitamin comparison score is based on the number of vitamins by which one or the other food is richer. The "coverage" charts below show how much of the daily needs can be covered by 300 grams of the food.
3
100 g
300 g
1 small (2-3/8" dia) - 96g 1 fruit (2-5/8" dia) - 131g 1 cup, sections - 180g 1 large (3-1/16" dia) - 184g
Vitamin C
Vit. C
Vitamin D
Vit. D
Vitamin A
Vit. A
Vitamin E
Vit. E
Vitamin B1
Vit. B1
Vitamin B2
Vit. B2
Vitamin B3
Vit. B3
Vitamin B5
Vit. B5
Vitamin B6
Vit. B6
Vitamin B12
Vit. B12
Vitamin K
Vit. K
Folate
Folate
177%
0%
3.7%
3.6%
22%
9.2%
5.3%
15%
14%
0%
0%
23%
9
100 g
300 g
1 tbsp - 8.5g 1 large - 50g 1 cup, chopped - 136g
Vitamin C
Vit. C
Vitamin D
Vit. D
Vitamin A
Vit. A
Vitamin E
Vit. E
Vitamin B1
Vit. B1
Vitamin B2
Vit. B2
Vitamin B3
Vit. B3
Vitamin B5
Vit. B5
Vitamin B6
Vit. B6
Vitamin B12
Vit. B12
Vitamin K
Vit. K
Folate
Folate
0%
33%
50%
21%
17%
118%
1.2%
84%
28%
139%
0.75%
33%
All nutrients comparison - raw data values
Nutrient
DV% diff.
Copper
0.045mg
2mg
217%
Cholesterol
0mg
373mg
124%
Vitamin C
53.2mg
0mg
59%
Selenium
0.5µg
30.8µg
55%
Choline
8.4mg
293.8mg
52%
Vitamin B12
0µg
1.11µg
46%
Vitamin B2
0.04mg
0.513mg
36%
Protein
0.94g
12.58g
23%
Phosphorus
14mg
172mg
23%
Vitamin B5
0.25mg
1.398mg
23%
Fats
0.12g
10.61g
16%
Vitamin A
11µg
149µg
15%
Saturated fat
0.015g
3.267g
15%
Iron
0.1mg
1.19mg
14%
Vitamin D*
0 IU
87 IU
11%
Vitamin D
0µg
2.2µg
11%
Fiber
2.4g
0g
10%
Monounsaturated fat
0.023g
4.077g
10%
Zinc
0.07mg
1.05mg
9%
Polyunsaturated fat
0.025g
1.414g
9%
Vitamin E
0.18mg
1.03mg
6%
Calories
47kcal
155kcal
5%
Sodium
0mg
124mg
5%
Vitamin B6
0.06mg
0.121mg
5%
Carbs
11.75g
1.12g
4%
Folate
30µg
44µg
4%
Potassium
181mg
126mg
2%
Vitamin B1
0.087mg
0.066mg
2%
Calcium
40mg
50mg
1%
Vitamin B3
0.282mg
0.064mg
1%
Protein per 100 calories
2g
8.1g
N/A
Calories per 10 g protein
500kcal
123kcal
N/A
Weight per 100 calories
213g
65g
N/A
Unsaturated / Saturated Fat ratio
3.2
1.7
N/A
Net carbs
9.35g
1.12g
N/A
Magnesium
10mg
10mg
0%
Sugar
9.35g
1.12g
N/A
Manganese
0.025mg
0.026mg
0%
Vitamin K
0µg
0.3µg
0%
Tryptophan
0.009mg
0.153mg
0%
Threonine
0.015mg
0.604mg
0%
Isoleucine
0.025mg
0.686mg
0%
Leucine
0.023mg
1.075mg
0%
Lysine
0.047mg
0.904mg
0%
Methionine
0.02mg
0.392mg
0%
Phenylalanine
0.031mg
0.668mg
0%
Valine
0.04mg
0.767mg
0%
Histidine
0.018mg
0.298mg
0%
Omega-3 - EPA
0g
0.005g
N/A
Omega-3 - DHA
0g
0.038g
N/A
Macronutrient Comparison
Macronutrient breakdown side-by-side comparison
2
12%
87%
Protein:
0.94 g
Fats:
0.12 g
Carbs:
11.75 g
Water:
86.75 g
Other:
0.44 g
3
13%
11%
75%
Protein:
12.58 g
Fats:
10.61 g
Carbs:
1.12 g
Water:
74.62 g
Other:
1.07 g
Contains
more
Carbs Carbs
+949.1%
Contains
more
Water Water
+16.3%
Contains
more
Protein Protein
+1238.3%
Contains
more
Fats Fats
+8741.7%
Contains
more
Other Other
+143.2%
Fat Type Comparison
Fat type breakdown side-by-side comparison
1
24%
37%
40%
Saturated fat:
Sat. Fat
0.015 g
Monounsaturated fat:
Mono. Fat
0.023 g
Polyunsaturated fat:
Poly. Fat
0.025 g
2
37%
47%
16%
Saturated fat:
Sat. Fat
3.267 g
Monounsaturated fat:
Mono. Fat
4.077 g
Polyunsaturated fat:
Poly. Fat
1.414 g
Contains
less
Sat. Fat Saturated fat
-99.5%
Contains
more
Mono. Fat Monounsaturated fat
+17626.1%
Contains
more
Poly. Fat Polyunsaturated fat
+5556%