How are ostrich and foie gras different? Ostrich is richer in vitamin B6, zinc, and vitamin B3, while foie gras is higher in vitamin B12, vitamin A, iron, and copper. Foie gras covers your daily need for vitamin B12, 131% more than ostrich. Ostrich contains 9 times more vitamin B6 than foie gras. Ostrich contains 0.545mg of vitamin B6, while foie gras contains 0.06mg. Ostrich is lower in cholesterol. Ostrich, tip trimmed, cooked and Pate de foie gras, canned (goose liver pate), smoked types were used in this article.
Infographic
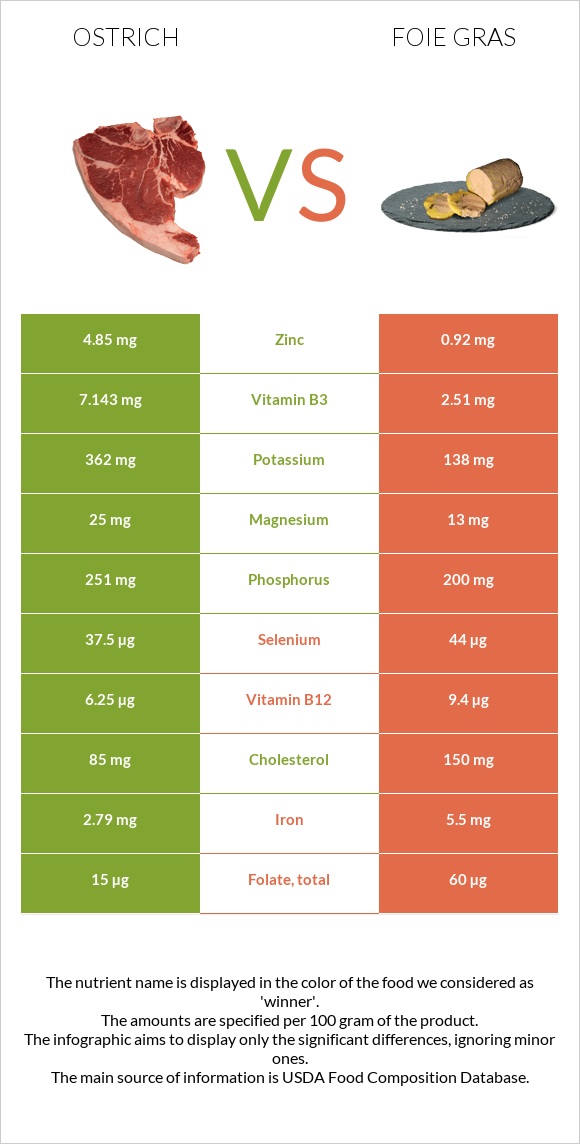
Mineral Comparison
Mineral comparison score is based on the number of minerals by which one or the other food is richer. The "coverage" charts below show how much of the daily needs can be covered by 300 grams of the food.
5
100 g
300 g
1 serving ( 3 oz ) - 85g
Magnesium
Magnesium
Calcium
Calcium
Potassium
Potassium
Iron
Iron
Copper
Copper
Zinc
Zinc
Phosphorus
Phosphorus
Sodium
Sodium
Manganese
Manganese
Selenium
Selenium
18%
1.8%
32%
105%
51%
132%
108%
10%
2.5%
205%
5
100 g
300 g
1 tbsp - 13g 1 oz - 28.35g
Magnesium
Magnesium
Calcium
Calcium
Potassium
Potassium
Iron
Iron
Copper
Copper
Zinc
Zinc
Phosphorus
Phosphorus
Sodium
Sodium
Manganese
Manganese
Selenium
Selenium
9.3%
21%
12%
206%
133%
25%
86%
91%
16%
240%
Vitamin Comparison
Vitamin comparison score is based on the number of vitamins by which one or the other food is richer. The "coverage" charts below show how much of the daily needs can be covered by 300 grams of the food.
4
100 g
300 g
1 serving ( 3 oz ) - 85g
Vitamin C
Vit. C
Vitamin D
Vit. D
Vitamin A
Vit. A
Vitamin E
Vit. E
Vitamin B1
Vit. B1
Vitamin B2
Vit. B2
Vitamin B3
Vit. B3
Vitamin B5
Vit. B5
Vitamin B6
Vit. B6
Vitamin B12
Vit. B12
Vitamin K
Vit. K
Folate
Folate
0%
0%
0%
4.6%
58%
67%
134%
79%
126%
781%
0%
11%
4
100 g
300 g
1 tbsp - 13g 1 oz - 28.35g
Vitamin C
Vit. C
Vitamin D
Vit. D
Vitamin A
Vit. A
Vitamin E
Vit. E
Vitamin B1
Vit. B1
Vitamin B2
Vit. B2
Vitamin B3
Vit. B3
Vitamin B5
Vit. B5
Vitamin B6
Vit. B6
Vitamin B12
Vit. B12
Vitamin K
Vit. K
Folate
Folate
6.7%
0%
334%
0%
22%
69%
47%
72%
14%
1175%
0%
45%
All nutrients comparison - raw data values
Nutrient
DV% diff.
Vitamin B12
6.25µg
9.4µg
131%
Vitamin A
0µg
1001µg
111%
Fats
2.57g
43.84g
63%
Monounsaturated fat
0.97g
25.61g
62%
Saturated fat
1g
14.45g
61%
Vitamin B6
0.545mg
0.06mg
37%
Zinc
4.85mg
0.92mg
36%
Protein
28.49g
11.4g
34%
Iron
2.79mg
5.5mg
34%
Vitamin B3
7.143mg
2.51mg
29%
Copper
0.152mg
0.4mg
28%
Sodium
80mg
697mg
27%
Cholesterol
85mg
150mg
22%
Calories
145kcal
462kcal
16%
Selenium
37.5µg
44µg
12%
Vitamin B1
0.232mg
0.088mg
12%
Folate
15µg
60µg
11%
Potassium
362mg
138mg
7%
Phosphorus
251mg
200mg
7%
Calcium
6mg
70mg
6%
Manganese
0.019mg
0.12mg
4%
Magnesium
25mg
13mg
3%
Polyunsaturated fat
0.44g
0.84g
3%
Vitamin C
0mg
2mg
2%
Carbs
0g
4.67g
2%
Vitamin E
0.23mg
2%
Vitamin B5
1.318mg
1.2mg
2%
Vitamin B2
0.292mg
0.299mg
1%
Protein per 100 calories
20g
2.5g
N/A
Calories per 10 g protein
51kcal
405kcal
N/A
Weight per 100 calories
69g
22g
N/A
Unsaturated / Saturated Fat ratio
1.4
1.8
N/A
Net carbs
0g
4.67g
N/A
Tryptophan
0.254mg
0.161mg
0%
Threonine
1.25mg
0.507mg
0%
Isoleucine
1.354mg
0.606mg
0%
Leucine
2.315mg
1.029mg
0%
Lysine
2.516mg
0.863mg
0%
Methionine
0.796mg
0.27mg
0%
Phenylalanine
1.176mg
0.567mg
0%
Valine
1.407mg
0.719mg
0%
Histidine
0.716mg
0.303mg
0%
Macronutrient Comparison
Macronutrient breakdown side-by-side comparison
2
28%
3%
69%
Protein:
28.49 g
Fats:
2.57 g
Carbs:
0 g
Water:
68.51 g
Other:
0.43 g
3
11%
44%
5%
37%
3%
Protein:
11.4 g
Fats:
43.84 g
Carbs:
4.67 g
Water:
37.04 g
Other:
3.05 g
Contains
more
Protein Protein
+149.9%
Contains
more
Water Water
+85%
Contains
more
Fats Fats
+1605.8%
Contains
more
Carbs Carbs
+∞%
Contains
more
Other Other
+609.3%
Fat Type Comparison
Fat type breakdown side-by-side comparison
1
41%
40%
18%
Saturated fat:
Sat. Fat
1 g
Monounsaturated fat:
Mono. Fat
0.97 g
Polyunsaturated fat:
Poly. Fat
0.44 g
2
35%
63%
2%
Saturated fat:
Sat. Fat
14.45 g
Monounsaturated fat:
Mono. Fat
25.61 g
Polyunsaturated fat:
Poly. Fat
0.84 g
Contains
less
Sat. Fat Saturated fat
-93.1%
Contains
more
Mono. Fat Monounsaturated fat
+2540.2%
Contains
more
Poly. Fat Polyunsaturated fat
+90.9%