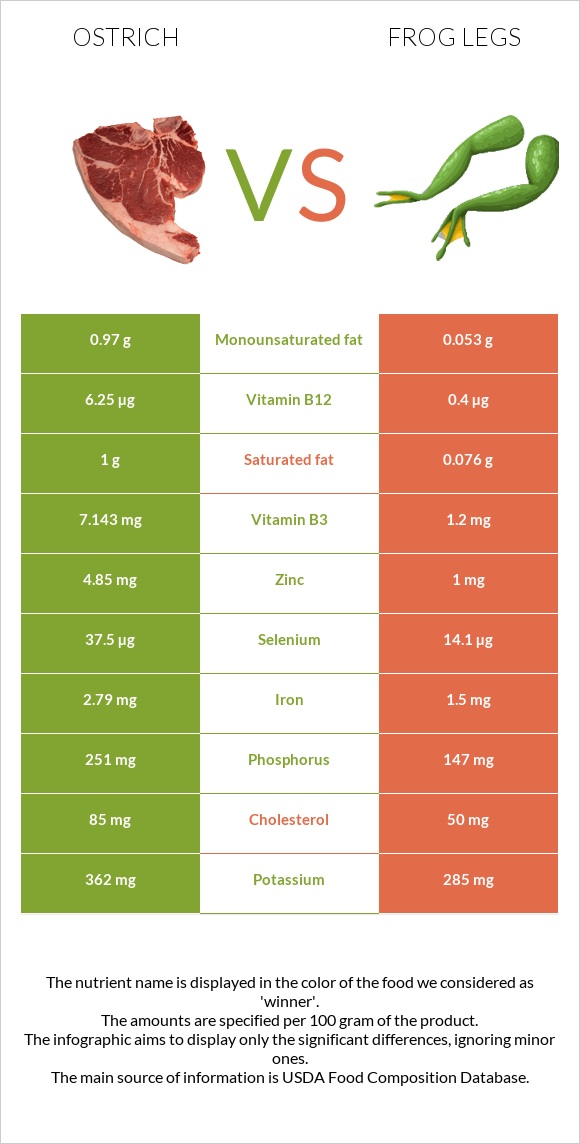
What are the main differences between ostrich and frog legs? Ostrich is richer in vitamin B12, selenium, vitamin B3, zinc, vitamin B6, iron, phosphorus, and vitamin B1, yet frog legs are richer in copper. Ostrich's daily need coverage for vitamin B12 is 244% higher. Ostrich has 6 times more vitamin B3 than frog legs. Ostrich has 7.143mg of vitamin B3, while frog legs have 1.2mg. Frog legs contain less cholesterol. We used Ostrich, tip trimmed, cooked and Frog legs, raw types in this comparison.
Infographic
Mineral Comparison
Mineral comparison score is based on the number of minerals by which one or the other food is richer. The "coverage" charts below show how much of the daily needs can be covered by 300 grams of the food.
7
100 g
300 g
1 serving ( 3 oz ) - 85g
Magnesium
Magnesium
Calcium
Calcium
Potassium
Potassium
Iron
Iron
Copper
Copper
Zinc
Zinc
Phosphorus
Phosphorus
Sodium
Sodium
Manganese
Manganese
Selenium
Selenium
18%
1.8%
32%
105%
51%
132%
108%
10%
2.5%
205%
3
100 g
300 g
1 leg - 45g
Magnesium
Magnesium
Calcium
Calcium
Potassium
Potassium
Iron
Iron
Copper
Copper
Zinc
Zinc
Phosphorus
Phosphorus
Sodium
Sodium
Manganese
Manganese
Selenium
Selenium
14%
5.4%
25%
56%
83%
27%
63%
7.6%
0%
77%
Vitamin Comparison
Vitamin comparison score is based on the number of vitamins by which one or the other food is richer. The "coverage" charts below show how much of the daily needs can be covered by 300 grams of the food.
6
100 g
300 g
1 serving ( 3 oz ) - 85g
Vitamin C
Vit. C
Vitamin D
Vit. D
Vitamin A
Vit. A
Vitamin E
Vit. E
Vitamin B1
Vit. B1
Vitamin B2
Vit. B2
Vitamin B3
Vit. B3
Vitamin B5
Vit. B5
Vitamin B6
Vit. B6
Vitamin B12
Vit. B12
Vitamin K
Vit. K
Folate
Folate
0%
0%
0%
4.6%
58%
67%
134%
79%
126%
781%
0%
11%
4
100 g
300 g
1 leg - 45g
Vitamin C
Vit. C
Vitamin D
Vit. D
Vitamin A
Vit. A
Vitamin E
Vit. E
Vitamin B1
Vit. B1
Vitamin B2
Vit. B2
Vitamin B3
Vit. B3
Vitamin B5
Vit. B5
Vitamin B6
Vit. B6
Vitamin B12
Vit. B12
Vitamin K
Vit. K
Folate
Folate
0%
3%
5%
20%
35%
58%
23%
0%
28%
50%
0.25%
11%
All nutrients comparison - raw data values
Nutrient
DV% diff.
Vitamin B12
6.25µg
0.4µg
244%
Selenium
37.5µg
14.1µg
43%
Vitamin B3
7.143mg
1.2mg
37%
Zinc
4.85mg
1mg
35%
Vitamin B6
0.545mg
0.12mg
33%
Vitamin B5
1.318mg
26%
Protein
28.49g
16.4g
24%
Iron
2.79mg
1.5mg
16%
Phosphorus
251mg
147mg
15%
Cholesterol
85mg
50mg
12%
Choline
65mg
12%
Copper
0.152mg
0.25mg
11%
Vitamin B1
0.232mg
0.14mg
8%
Vitamin E
0.23mg
1mg
5%
Calories
145kcal
73kcal
4%
Saturated fat
1g
0.076g
4%
Fats
2.57g
0.3g
3%
Vitamin B2
0.292mg
0.25mg
3%
Potassium
362mg
285mg
2%
Vitamin A
0µg
15µg
2%
Monounsaturated fat
0.97g
0.053g
2%
Polyunsaturated fat
0.44g
0.102g
2%
Vitamin D*
8 IU
1%
Vitamin D
0.2µg
1%
Magnesium
25mg
20mg
1%
Calcium
6mg
18mg
1%
Sodium
80mg
58mg
1%
Manganese
0.019mg
1%
Protein per 100 calories
20g
22g
N/A
Calories per 10 g protein
51kcal
45kcal
N/A
Weight per 100 calories
69g
137g
N/A
Unsaturated / Saturated Fat ratio
1.4
2
N/A
Vitamin K
0.1µg
0%
Folate
15µg
15µg
0%
Tryptophan
0.254mg
0%
Threonine
1.25mg
0%
Isoleucine
1.354mg
0%
Leucine
2.315mg
0%
Lysine
2.516mg
0%
Methionine
0.796mg
0%
Phenylalanine
1.176mg
0%
Valine
1.407mg
0%
Histidine
0.716mg
0%
Omega-3 - EPA
0.014g
N/A
Omega-3 - DHA
0.02g
N/A
Omega-3 - DPA
0.007g
N/A
Macronutrient Comparison
Macronutrient breakdown side-by-side comparison
2
28%
3%
69%
Protein:
28.49 g
Fats:
2.57 g
Carbs:
0 g
Water:
68.51 g
Other:
0.43 g
2
16%
82%
Protein:
16.4 g
Fats:
0.3 g
Carbs:
0 g
Water:
81.9 g
Other:
1.4 g
Contains
more
Protein Protein
+73.7%
Contains
more
Fats Fats
+756.7%
Contains
more
Water Water
+19.5%
Contains
more
Other Other
+225.6%
Fat Type Comparison
Fat type breakdown side-by-side comparison
2
41%
40%
18%
Saturated fat:
Sat. Fat
1 g
Monounsaturated fat:
Mono. Fat
0.97 g
Polyunsaturated fat:
Poly. Fat
0.44 g
1
33%
23%
44%
Saturated fat:
Sat. Fat
0.076 g
Monounsaturated fat:
Mono. Fat
0.053 g
Polyunsaturated fat:
Poly. Fat
0.102 g
Contains
more
Mono. Fat Monounsaturated fat
+1730.2%
Contains
more
Poly. Fat Polyunsaturated fat
+331.4%
Contains
less
Sat. Fat Saturated fat
-92.4%