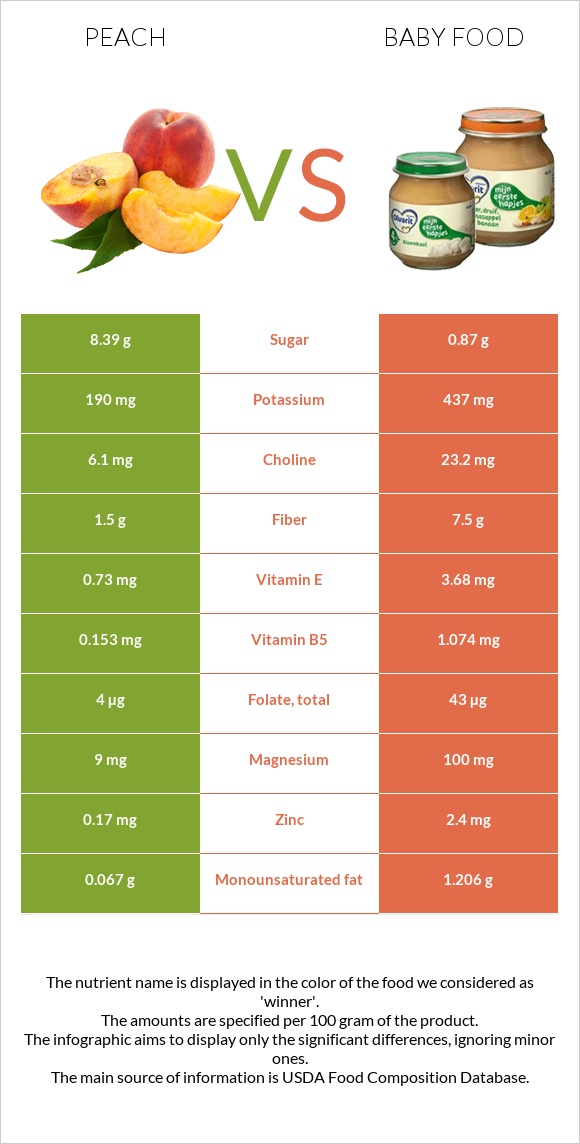
Differences between peach and baby food Peach contains less iron, vitamin B3, vitamin B2, vitamin B1, calcium, phosphorus, selenium, copper, fiber, and magnesium than baby food. Baby food's daily need coverage for iron is 591% higher. Peach has a lower glycemic index. The glycemic index of peach is 42, while the glycemic index of baby food is 56. The food types used in this comparison are Peaches, yellow, raw and Babyfood, cereal, mixed, dry fortified .
Infographic
Mineral Comparison
Mineral comparison score is based on the number of minerals by which one or the other food is richer. The "coverage" charts below show how much of the daily needs can be covered by 300 grams of the food.
2
100 g
300 g
1 small (2-1/2" dia) - 130g 1 NLEA serving - 147g 1 medium (2-2/3" dia) - 150g 1 cup slices - 154g 1 large (2-3/4" dia) - 175g 1 extra large (3" dia) - 224g
Magnesium
Magnesium
Calcium
Calcium
Potassium
Potassium
Iron
Iron
Copper
Copper
Zinc
Zinc
Phosphorus
Phosphorus
Sodium
Sodium
Manganese
Manganese
Selenium
Selenium
6.4%
1.8%
17%
9.4%
23%
4.6%
8.6%
0%
8%
0.55%
8
100 g
300 g
1 tbsp - 2.5g 0.5 oz - 15g
Magnesium
Magnesium
Calcium
Calcium
Potassium
Potassium
Iron
Iron
Copper
Copper
Zinc
Zinc
Phosphorus
Phosphorus
Sodium
Sodium
Manganese
Manganese
Selenium
Selenium
71%
220%
39%
1781%
111%
65%
168%
0.39%
0%
141%
Vitamin Comparison
Vitamin comparison score is based on the number of vitamins by which one or the other food is richer. The "coverage" charts below show how much of the daily needs can be covered by 300 grams of the food.
3
100 g
300 g
1 small (2-1/2" dia) - 130g 1 NLEA serving - 147g 1 medium (2-2/3" dia) - 150g 1 cup slices - 154g 1 large (2-3/4" dia) - 175g 1 extra large (3" dia) - 224g
Vitamin C
Vit. C
Vitamin D
Vit. D
Vitamin A
Vit. A
Vitamin E
Vit. E
Vitamin B1
Vit. B1
Vitamin B2
Vit. B2
Vitamin B3
Vit. B3
Vitamin B5
Vit. B5
Vitamin B6
Vit. B6
Vitamin B12
Vit. B12
Vitamin K
Vit. K
Folate
Folate
22%
0%
5.3%
15%
6%
7.2%
15%
9.2%
5.8%
0%
6.5%
3%
7
100 g
300 g
1 tbsp - 2.5g 0.5 oz - 15g
Vitamin C
Vit. C
Vitamin D
Vit. D
Vitamin A
Vit. A
Vitamin E
Vit. E
Vitamin B1
Vit. B1
Vitamin B2
Vit. B2
Vitamin B3
Vit. B3
Vitamin B5
Vit. B5
Vitamin B6
Vit. B6
Vitamin B12
Vit. B12
Vitamin K
Vit. K
Folate
Folate
7.7%
0%
0.33%
74%
610%
627%
651%
64%
44%
0%
3.8%
32%
All nutrients comparison - raw data values
Nutrient
DV% diff.
Iron
0.25mg
47.5mg
591%
Vitamin B3
0.806mg
34.714mg
212%
Vitamin B2
0.031mg
2.717mg
207%
Vitamin B1
0.024mg
2.438mg
201%
Calcium
6mg
733mg
73%
Phosphorus
20mg
392mg
53%
Selenium
0.1µg
25.9µg
47%
Copper
0.068mg
0.334mg
30%
Fiber
1.5g
7.5g
24%
Protein
0.91g
12.2g
23%
Magnesium
9mg
100mg
22%
Carbs
9.54g
73.4g
21%
Zinc
0.17mg
2.4mg
20%
Vitamin E
0.73mg
3.68mg
20%
Vitamin B5
0.153mg
1.074mg
18%
Calories
39kcal
379kcal
17%
Vitamin B6
0.025mg
0.189mg
13%
Polyunsaturated fat
0.086g
1.697g
11%
Folate
4µg
43µg
10%
Potassium
190mg
437mg
7%
Fats
0.25g
4.4g
6%
Vitamin C
6.6mg
2.3mg
5%
Manganese
0.061mg
3%
Choline
6.1mg
23.2mg
3%
Saturated fat
0.019g
0.769g
3%
Monounsaturated fat
0.067g
1.206g
3%
Vitamin A
16µg
1µg
2%
Fructose
1.53g
2%
Vitamin K
2.6µg
1.5µg
1%
Protein per 100 calories
2.3g
3.2g
N/A
Calories per 10 g protein
429kcal
311kcal
N/A
Weight per 100 calories
256g
26g
N/A
Unsaturated / Saturated Fat ratio
8.1
3.8
N/A
Net carbs
8.04g
65.9g
N/A
Sugar
8.39g
0.87g
N/A
Sodium
0mg
3mg
0%
Tryptophan
0.01mg
0.158mg
0%
Threonine
0.016mg
0.4mg
0%
Isoleucine
0.017mg
0.477mg
0%
Leucine
0.027mg
1.041mg
0%
Lysine
0.03mg
0.404mg
0%
Methionine
0.01mg
0.24mg
0%
Phenylalanine
0.019mg
0.672mg
0%
Valine
0.022mg
0.653mg
0%
Histidine
0.013mg
0.286mg
0%
Macronutrient Comparison
Macronutrient breakdown side-by-side comparison
1
10%
89%
Protein:
0.91 g
Fats:
0.25 g
Carbs:
9.54 g
Water:
88.87 g
Other:
0.43 g
4
12%
4%
73%
7%
3%
Protein:
12.2 g
Fats:
4.4 g
Carbs:
73.4 g
Water:
6.7 g
Other:
3.3 g
Contains
more
Water Water
+1226.4%
Contains
more
Protein Protein
+1240.7%
Contains
more
Fats Fats
+1660%
Contains
more
Carbs Carbs
+669.4%
Contains
more
Other Other
+667.4%
Fat Type Comparison
Fat type breakdown side-by-side comparison
1
11%
39%
50%
Saturated fat:
Sat. Fat
0.019 g
Monounsaturated fat:
Mono. Fat
0.067 g
Polyunsaturated fat:
Poly. Fat
0.086 g
2
21%
33%
46%
Saturated fat:
Sat. Fat
0.769 g
Monounsaturated fat:
Mono. Fat
1.206 g
Polyunsaturated fat:
Poly. Fat
1.697 g
Contains
less
Sat. Fat Saturated fat
-97.5%
Contains
more
Mono. Fat Monounsaturated fat
+1700%
Contains
more
Poly. Fat Polyunsaturated fat
+1873.3%