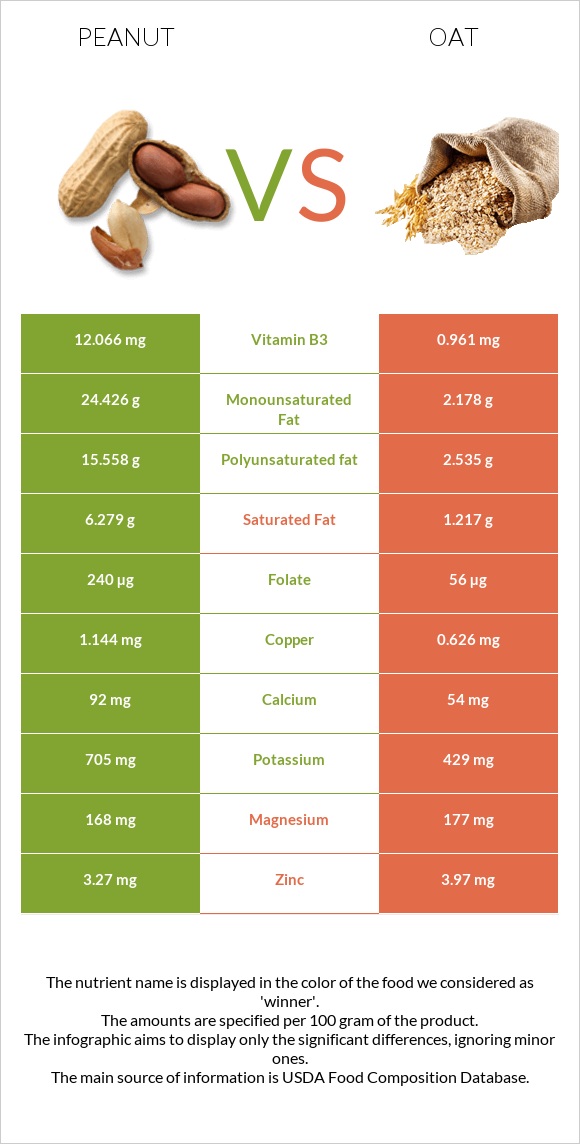
A recap on the differences between peanuts and oats Peanuts are higher in vitamin B3, copper, folate, vitamin B6, and vitamin B5, yet oats are higher in manganese, phosphorus, vitamin B1, and fiber. Oats cover your daily manganese needs 130% more than peanuts. Peanuts contain 13 times more vitamin B3 than oats. While peanuts contain 12.066mg of vitamin B3, oats contain only 0.961mg. The amount of saturated fat in oats is lower. The glycemic index of peanuts is lower. Food varieties used in this article are Peanuts, all types, raw and Oats .
Infographic
Mineral Comparison
Mineral comparison score is based on the number of minerals by which one or the other food is richer. The "coverage" charts below show how much of the daily needs can be covered by 300 grams of the food.
4
100 g
300 g
1 oz - 28.35g 1 cup - 146g
Magnesium
Magnesium
Calcium
Calcium
Potassium
Potassium
Iron
Iron
Copper
Copper
Zinc
Zinc
Phosphorus
Phosphorus
Sodium
Sodium
Manganese
Manganese
Selenium
Selenium
120%
28%
62%
172%
381%
89%
161%
2.3%
252%
39%
4
100 g
300 g
1 cup - 156g
Magnesium
Magnesium
Calcium
Calcium
Potassium
Potassium
Iron
Iron
Copper
Copper
Zinc
Zinc
Phosphorus
Phosphorus
Sodium
Sodium
Manganese
Manganese
Selenium
Selenium
126%
16%
38%
177%
209%
108%
224%
0.26%
641%
0%
Vitamin Comparison
Vitamin comparison score is based on the number of vitamins by which one or the other food is richer. The "coverage" charts below show how much of the daily needs can be covered by 300 grams of the food.
5
100 g
300 g
1 oz - 28.35g 1 cup - 146g
Vitamin C
Vit. C
Vitamin D
Vit. D
Vitamin A
Vit. A
Vitamin E
Vit. E
Vitamin B1
Vit. B1
Vitamin B2
Vit. B2
Vitamin B3
Vit. B3
Vitamin B5
Vit. B5
Vitamin B6
Vit. B6
Vitamin B12
Vit. B12
Vitamin K
Vit. K
Folate
Folate
0%
0%
0%
167%
160%
31%
226%
106%
80%
0%
0%
180%
1
100 g
300 g
1 cup - 156g
Vitamin C
Vit. C
Vitamin D
Vit. D
Vitamin A
Vit. A
Vitamin E
Vit. E
Vitamin B1
Vit. B1
Vitamin B2
Vit. B2
Vitamin B3
Vit. B3
Vitamin B5
Vit. B5
Vitamin B6
Vit. B6
Vitamin B12
Vit. B12
Vitamin K
Vit. K
Folate
Folate
0%
0%
0%
0%
191%
32%
18%
81%
27%
0%
0%
42%
All nutrients comparison - raw data values
Nutrient
DV% diff.
Manganese
1.934mg
4.916mg
130%
Polyunsaturated fat
15.558g
2.535g
87%
Vitamin B3
12.066mg
0.961mg
69%
Fats
49.24g
6.9g
65%
Copper
1.144mg
0.626mg
58%
Vitamin E
8.33mg
56%
Monounsaturated fat
24.426g
2.178g
56%
Folate
240µg
56µg
46%
Saturated fat
6.279g
1.217g
23%
Phosphorus
376mg
523mg
21%
Protein
25.8g
16.89g
18%
Vitamin B6
0.348mg
0.119mg
18%
Carbs
16.13g
66.27g
17%
Selenium
7.2µg
13%
Vitamin B1
0.64mg
0.763mg
10%
Choline
52.5mg
10%
Calories
567kcal
389kcal
9%
Potassium
705mg
429mg
8%
Fiber
8.5g
10.6g
8%
Vitamin B5
1.767mg
1.349mg
8%
Zinc
3.27mg
3.97mg
6%
Calcium
92mg
54mg
4%
Magnesium
168mg
177mg
2%
Iron
4.58mg
4.72mg
2%
Sodium
18mg
2mg
1%
Protein per 100 calories
4.6g
4.3g
N/A
Calories per 10 g protein
220kcal
230kcal
N/A
Weight per 100 calories
18g
26g
N/A
Unsaturated / Saturated Fat ratio
6.4
3.9
N/A
Net carbs
7.63g
55.67g
N/A
Sugar
4.72g
N/A
Vitamin B2
0.135mg
0.139mg
0%
Tryptophan
0.25mg
0.234mg
0%
Threonine
0.883mg
0.575mg
0%
Isoleucine
0.907mg
0.694mg
0%
Leucine
1.672mg
1.284mg
0%
Lysine
0.926mg
0.701mg
0%
Methionine
0.317mg
0.312mg
0%
Phenylalanine
1.377mg
0.895mg
0%
Valine
1.082mg
0.937mg
0%
Histidine
0.652mg
0.405mg
0%
Macronutrient Comparison
Macronutrient breakdown side-by-side comparison
3
26%
49%
16%
7%
2%
Protein:
25.8 g
Fats:
49.24 g
Carbs:
16.13 g
Water:
6.5 g
Other:
2.33 g
2
17%
7%
66%
8%
2%
Protein:
16.89 g
Fats:
6.9 g
Carbs:
66.27 g
Water:
8.22 g
Other:
1.72 g
Contains
more
Protein Protein
+52.8%
Contains
more
Fats Fats
+613.6%
Contains
more
Other Other
+35.5%
Contains
more
Carbs Carbs
+310.8%
Contains
more
Water Water
+26.5%
Fat Type Comparison
Fat type breakdown side-by-side comparison
2
14%
53%
34%
Saturated fat:
Sat. Fat
6.279 g
Monounsaturated fat:
Mono. Fat
24.426 g
Polyunsaturated fat:
Poly. Fat
15.558 g
1
21%
37%
43%
Saturated fat:
Sat. Fat
1.217 g
Monounsaturated fat:
Mono. Fat
2.178 g
Polyunsaturated fat:
Poly. Fat
2.535 g
Contains
more
Mono. Fat Monounsaturated fat
+1021.5%
Contains
more
Poly. Fat Polyunsaturated fat
+513.7%
Contains
less
Sat. Fat Saturated fat
-80.6%