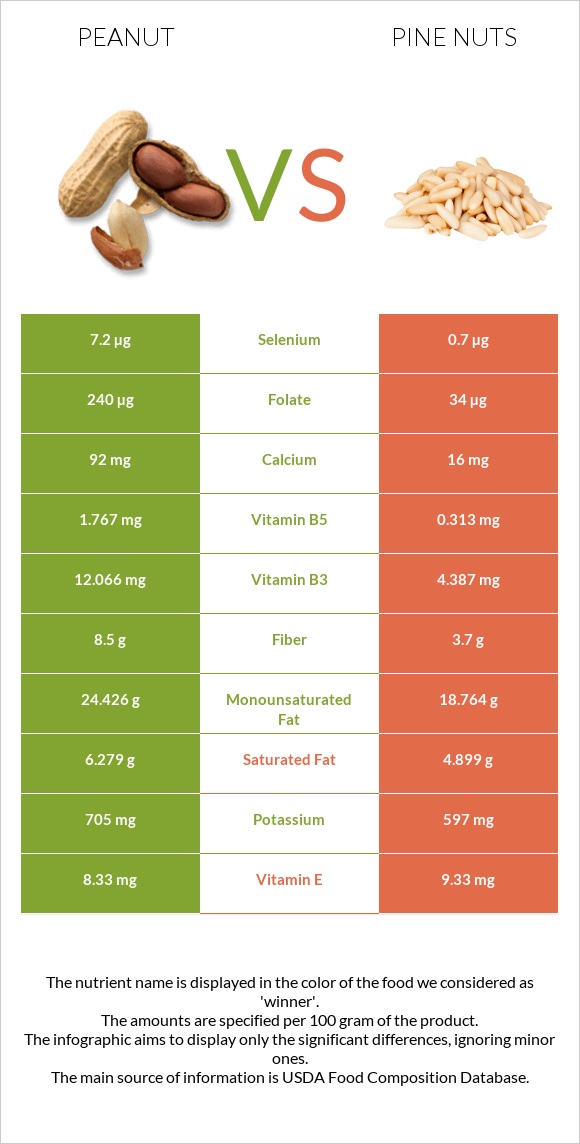
The main differences between peanuts and pine nuts Peanuts are richer in folate, vitamin B3, vitamin B5, and vitamin B1, yet pine nuts are richer in manganese, vitamin K, zinc, phosphorus, copper, and magnesium. Daily need coverage for manganese for pine nuts is 299% higher. Peanuts contain 7 times more folate than pine nuts. Peanuts contain 240µg of folate, while pine nuts contain 34µg. Food types used in this article are Peanuts, all types, raw and Nuts, pine nuts, dried .
Infographic
Mineral Comparison
Mineral comparison score is based on the number of minerals by which one or the other food is richer. The "coverage" charts below show how much of the daily needs can be covered by 300 grams of the food.
3
100 g
300 g
1 oz - 28.35g 1 cup - 146g
Magnesium
Magnesium
Calcium
Calcium
Potassium
Potassium
Iron
Iron
Copper
Copper
Zinc
Zinc
Phosphorus
Phosphorus
Sodium
Sodium
Manganese
Manganese
Selenium
Selenium
120%
28%
62%
172%
381%
89%
161%
2.3%
252%
39%
7
100 g
300 g
10 nuts - 1.7g 1 oz (167 kernels) - 28.35g 1 cup - 135g
Magnesium
Magnesium
Calcium
Calcium
Potassium
Potassium
Iron
Iron
Copper
Copper
Zinc
Zinc
Phosphorus
Phosphorus
Sodium
Sodium
Manganese
Manganese
Selenium
Selenium
179%
4.8%
53%
207%
441%
176%
246%
0.26%
1148%
3.8%
Vitamin Comparison
Vitamin comparison score is based on the number of vitamins by which one or the other food is richer. The "coverage" charts below show how much of the daily needs can be covered by 300 grams of the food.
5
100 g
300 g
1 oz - 28.35g 1 cup - 146g
Vitamin C
Vit. C
Vitamin D
Vit. D
Vitamin A
Vit. A
Vitamin E
Vit. E
Vitamin B1
Vit. B1
Vitamin B2
Vit. B2
Vitamin B3
Vit. B3
Vitamin B5
Vit. B5
Vitamin B6
Vit. B6
Vitamin B12
Vit. B12
Vitamin K
Vit. K
Folate
Folate
0%
0%
0%
167%
160%
31%
226%
106%
80%
0%
0%
180%
5
100 g
300 g
10 nuts - 1.7g 1 oz (167 kernels) - 28.35g 1 cup - 135g
Vitamin C
Vit. C
Vitamin D
Vit. D
Vitamin A
Vit. A
Vitamin E
Vit. E
Vitamin B1
Vit. B1
Vitamin B2
Vit. B2
Vitamin B3
Vit. B3
Vitamin B5
Vit. B5
Vitamin B6
Vit. B6
Vitamin B12
Vit. B12
Vitamin K
Vit. K
Folate
Folate
2.7%
0%
0.33%
187%
91%
52%
82%
19%
22%
0%
135%
26%
All nutrients comparison - raw data values
Nutrient
DV% diff.
Manganese
1.934mg
8.802mg
299%
Polyunsaturated fat
15.558g
34.071g
123%
Folate
240µg
34µg
52%
Vitamin B3
12.066mg
4.387mg
48%
Vitamin K
0µg
53.9µg
45%
Fats
49.24g
68.37g
29%
Zinc
3.27mg
6.45mg
29%
Vitamin B5
1.767mg
0.313mg
29%
Phosphorus
376mg
575mg
28%
Protein
25.8g
13.69g
24%
Vitamin B1
0.64mg
0.364mg
23%
Magnesium
168mg
251mg
20%
Copper
1.144mg
1.324mg
20%
Vitamin B6
0.348mg
0.094mg
20%
Fiber
8.5g
3.7g
19%
Monounsaturated fat
24.426g
18.764g
14%
Iron
4.58mg
5.53mg
12%
Selenium
7.2µg
0.7µg
12%
Calcium
92mg
16mg
8%
Vitamin E
8.33mg
9.33mg
7%
Vitamin B2
0.135mg
0.227mg
7%
Saturated fat
6.279g
4.899g
6%
Calories
567kcal
673kcal
5%
Potassium
705mg
597mg
3%
Vitamin C
0mg
0.8mg
1%
Carbs
16.13g
13.08g
1%
Starch
1.43g
1%
Sodium
18mg
2mg
1%
Choline
52.5mg
55.8mg
1%
Protein per 100 calories
4.6g
2g
N/A
Calories per 10 g protein
220kcal
492kcal
N/A
Weight per 100 calories
18g
15g
N/A
Unsaturated / Saturated Fat ratio
6.4
11
N/A
Net carbs
7.63g
9.38g
N/A
Sugar
4.72g
3.59g
N/A
Vitamin A
0µg
1µg
0%
Tryptophan
0.25mg
0.107mg
0%
Threonine
0.883mg
0.37mg
0%
Isoleucine
0.907mg
0.542mg
0%
Leucine
1.672mg
0.991mg
0%
Lysine
0.926mg
0.54mg
0%
Methionine
0.317mg
0.259mg
0%
Phenylalanine
1.377mg
0.524mg
0%
Valine
1.082mg
0.687mg
0%
Histidine
0.652mg
0.341mg
0%
Fructose
0.07g
0%
Omega-3 - ALA
0.112g
N/A
Omega-6 - Gamma-linoleic acid
0.052g
N/A
Omega-6 - Eicosadienoic acid
0.404g
N/A
Macronutrient Comparison
Macronutrient breakdown side-by-side comparison
3
26%
49%
16%
7%
2%
Protein:
25.8 g
Fats:
49.24 g
Carbs:
16.13 g
Water:
6.5 g
Other:
2.33 g
2
14%
68%
13%
2%
3%
Protein:
13.69 g
Fats:
68.37 g
Carbs:
13.08 g
Water:
2.28 g
Other:
2.58 g
Contains
more
Protein Protein
+88.5%
Contains
more
Carbs Carbs
+23.3%
Contains
more
Water Water
+185.1%
Contains
more
Fats Fats
+38.9%
Contains
more
Other Other
+10.7%
Fat Type Comparison
Fat type breakdown side-by-side comparison
1
14%
53%
34%
Saturated fat:
Sat. Fat
6.279 g
Monounsaturated fat:
Mono. Fat
24.426 g
Polyunsaturated fat:
Poly. Fat
15.558 g
2
8%
33%
59%
Saturated fat:
Sat. Fat
4.899 g
Monounsaturated fat:
Mono. Fat
18.764 g
Polyunsaturated fat:
Poly. Fat
34.071 g
Contains
more
Mono. Fat Monounsaturated fat
+30.2%
Contains
less
Sat. Fat Saturated fat
-22%
Contains
more
Poly. Fat Polyunsaturated fat
+119%